
Every SOC analyst knows the feeling. An alert fires. You open the incident. And then the real work begins: correlating AWS CloudTrail API calls, translating firewall log schemas, joining tables across data sources you barely recognize — all to answer one question: what actually happened?
Microsoft’s new UEBA behaviors layer in Microsoft Sentinel changes that. Instead of forcing analysts to reconstruct the story from raw telemetry, it produces it for them — normalized, enriched, MITRE-mapped behavioral summaries that explain “who did what to whom” in plain language. It went generally available in early 2026, and if you’re running Sentinel with non-Microsoft data sources like AWS CloudTrail, Palo Alto, or GCP, this is something you should enable today.
In this post I’ll walk you through what the behaviors layer is, how it works under the hood, how to enable it, and what you can do with it — including practical KQL queries for investigation, threat hunting, and detection.
What is the UEBA behaviors layer?
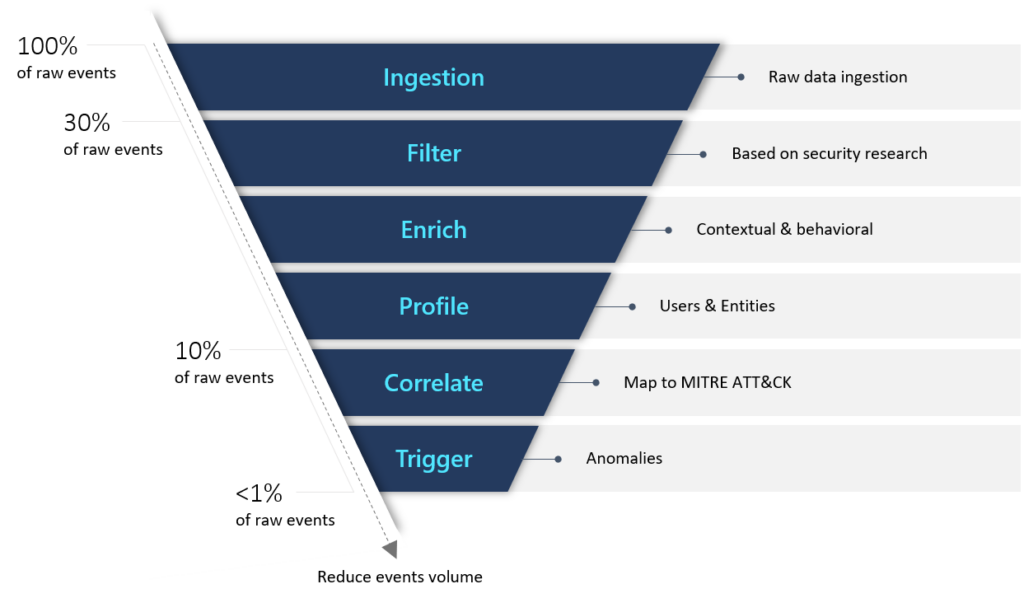
Before this feature existed, Microsoft Sentinel’s UEBA already provided anomaly detection — flagging when a user deviated from their behavioral baseline. That’s valuable, but anomalies are event-level: a single unusual API call, a first-time login from a new location.
The behaviors layer sits in a different spot in the stack. Rather than flagging individual events, it aggregates and sequences related events across a time window into a single, structured behavior record. Think of it as the difference between:
“User performed
s3:GetObject847 times between 14:00–15:00″
versus raw CloudTrail telling you nothing without a KQL query to make sense of it.
There are two types of behaviors:
- Aggregation behaviors — volume-based patterns. Example: “User accessed 50+ AWS resources in 1 hour.” Useful for spotting data exfiltration attempts or compromised accounts doing bulk operations.
- Sequencing behaviors — multi-step chains. Example: “Access key created → used from new IP → privileged API calls made.” These surface the kind of attack progressions that are invisible when you look at individual events.
Every behavior record includes:
- A plain-language title and description
- MITRE ATT&CK tactic and technique mapping
- Entity roles (who was the actor, what was the target)
- References back to the raw log events that contributed to it
Crucially, behaviors are not alerts. They don’t fire because something is malicious — they fire because a pattern was detected. That distinction matters: behaviors give you neutral, factual context that you then interpret in light of other signals.
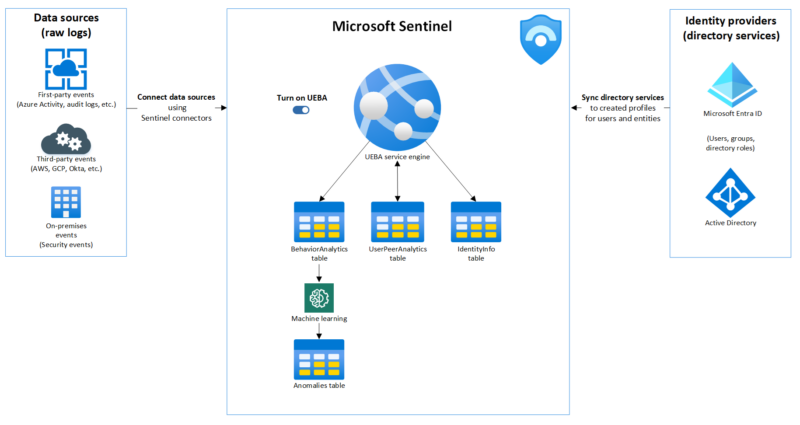
How it’s built: generative AI under the hood
The behaviors layer uses generative AI to create and scale the behavior logic. Microsoft uses AI to develop the detection patterns, map entities, perform MITRE mapping, and generate the natural-language explanations — all with quality guardrails to keep outputs consistent and auditable.
This is worth understanding because it explains the current scope: the initial release focuses on non-Microsoft data sources that traditionally lack easy behavioral context in Sentinel. Microsoft’s own data sources (Entra ID, Defender for Endpoint, etc.) already have rich signal — the gap has always been the third-party telemetry.
Supported data sources
At GA, the behaviors layer covers:
| Data source | Details |
|---|---|
| CommonSecurityLog | CyberArk Vault, Palo Alto Threats (vendor-specific — other vendors in CommonSecurityLog won’t generate behaviors) |
| AWSCloudTrail | EC2, IAM, S3, EKS, Secrets Manager and more |
| GCPAuditLogs | General GCP management activity |
Important: coverage is expanding over time, but you need to verify your specific vendor logs are supported before expecting results. If your CommonSecurityLog connector ingests data from unsupported vendors, the behaviors layer will simply not generate records for that data — it won’t error, it’ll just be silent.
How to enable the UEBA behaviors layer
Prerequisites
- Microsoft Sentinel workspace onboarded to the Defender portal — the Azure portal path does not support the behaviors layer
- One or more supported data sources ingested into the Analytics tier (not Auxiliary or Summary Rules tier — behaviors only process Analytics-tier data)
- Currently supported for a single workspace per tenant, so choose the one with the most relevant ingestion
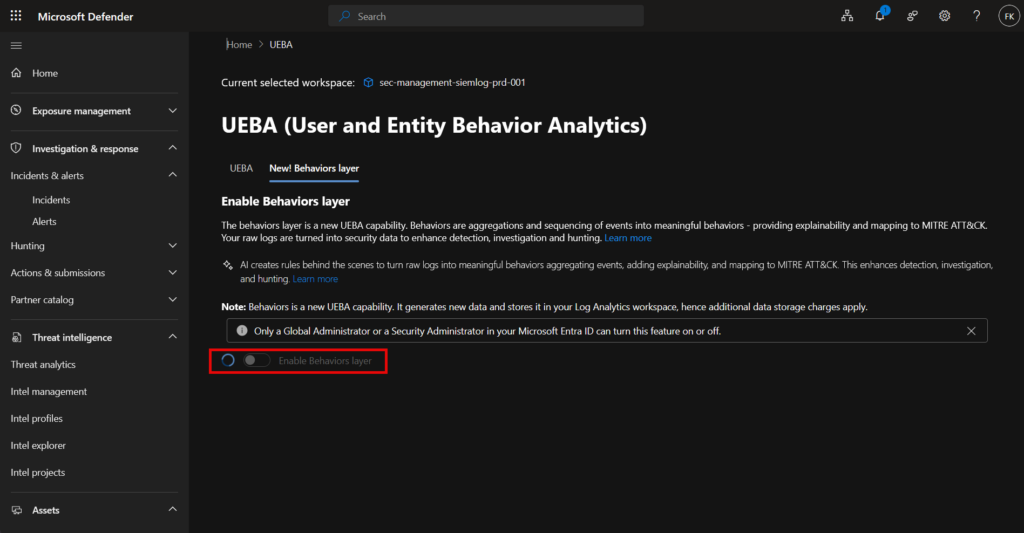
Enabling the behaviors layer
- In the Defender portal, go to Settings → Microsoft Sentinel → SIEM workspaces
- Select your workspace
- Go to Entity behavior analytics → Configure UEBA
- Navigate to the Behaviors layer tab — this is separate from the main UEBA toggle
- Enable the feature and connect your supported data sources
Note that data sources here are configured independently from regular UEBA. Even if you already have AWSCloudTrail enabled for UEBA anomalies, you need to explicitly enable it for the behaviors layer too.
Once enabled, two new tables appear in your Log Analytics workspace:
SentinelBehaviorInfo— the behavior records (title, description, MITRE mapping, time window)SentinelBehaviorEntities— the entities involved in each behavior (account, device, IP, etc.)
In Advanced Hunting, these tables appear without the “Sentinel” prefix — so BehaviorInfo and BehaviorEntities. If you already have Defender XDR behaviors enabled (e.g. from Defender for Cloud Apps), these queries will return results from both XDR and UEBA behaviors combined.
Querying behaviors: practical KQL
Investigating an entity during an incident
When you’re triaging an incident and want to understand what a specific account was doing:
let targetAccount = "[email protected]";
let lookback = 24h;
let behaviorIds =
    BehaviorEntities
    | where TimeGenerated > ago(lookback)
    | where AccountUpn == targetAccount
    | project BehaviorId;
BehaviorInfo
| where TimeGenerated > ago(lookback)
| join kind=inner (behaviorIds) on BehaviorId
| project TimeGenerated, Title, Description, AttackTechniques, Categories, BehaviorId
| order by TimeGenerated desc
This gives you a timeline of what that account did — at the behavior level, not the raw event level. Instead of reviewing hundreds of API calls, you see 3–5 meaningful summaries.
Threat hunting across the MITRE ATT&CK chain
Looking for entities that hit multiple tactics within a short window — a classic indicator of an active attack in progress:
let lookback = 12h;
let tacticFilter = dynamic(["Persistence", "Discovery", "PrivilegeEscalation"]);
let behaviorInfo =
    BehaviorInfo
    | where TimeGenerated > ago(lookback)
    | where Categories has_any (tacticFilter)
    | project BehaviorId, Categories, Title, TimeGenerated;
BehaviorEntities
| where TimeGenerated > ago(lookback)
| extend EntityName = coalesce(AccountUpn, DeviceName, CloudResourceId)
| join kind=inner (behaviorInfo) on BehaviorId
| summarize
    TacticsCovered = make_set(Categories),
    BehaviorTitles = make_set(Title),
    TotalBehaviors = count()
    by EntityName
| where array_length(TacticsCovered) >= 2
| order by TotalBehaviors desc
Entities showing up across multiple MITRE tactics in a 12-hour window are worth a closer look.
Finding the rarest behaviors
Rare behaviors are a natural hunting signal — if something only happened once or twice in your environment, it’s worth understanding why:
BehaviorInfo
| where TimeGenerated > ago(7d)
| summarize
    Occurrences = dcount(BehaviorId),
    FirstSeen = min(TimeGenerated),
    LastSeen = max(TimeGenerated)
    by Title, AttackTechniques
| order by Occurrences asc
| take 20
This gives you a ranked list of the rarest behavior types seen in the last 7 days — a good starting point for building analytics rules on top of behaviors rather than raw logs.
Filtering by MITRE technique
If you want to scope an investigation to a specific technique — say you’ve had a threat intel tip about T1552 (Unsecured Credentials):
let targetTechniques = dynamic(["T1552", "T1078"]);
let behaviorInfoFiltered =
    BehaviorInfo
    | where TimeGenerated > ago(48h)
    | where AttackTechniques has_any (targetTechniques)
    | project BehaviorId, AttackTechniques, Title;
BehaviorEntities
| where TimeGenerated > ago(48h)
| join kind=inner (behaviorInfoFiltered) on BehaviorId
| project TimeGenerated, AccountUpn, CloudResourceId, Title, AttackTechniques
| order by TimeGenerated desc
The UEBA behaviors workbook
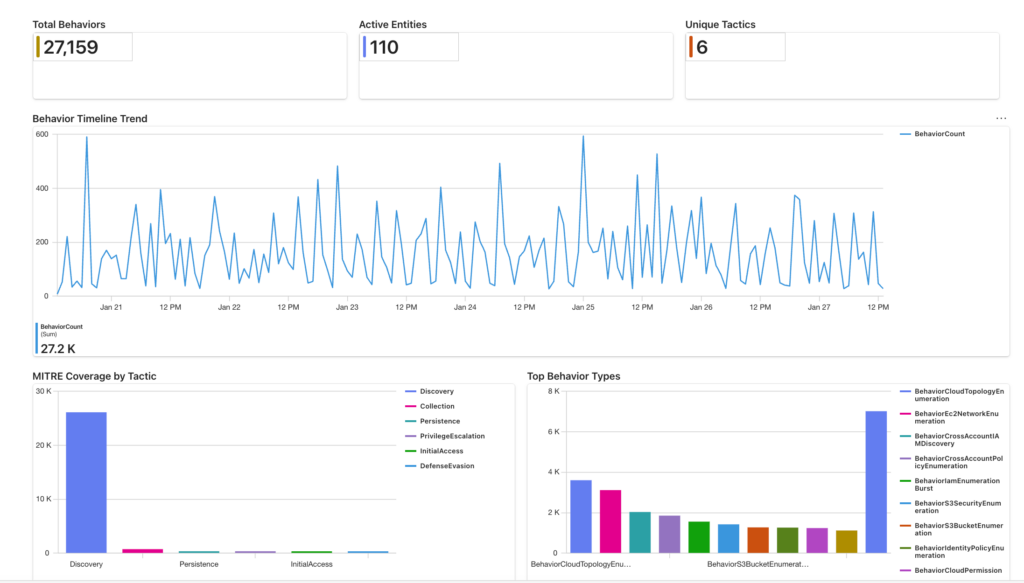
Microsoft also released the UEBA behaviors workbook as part of the UEBA essentials solution in the Content Hub. It provides three pre-built tabs:
- Overview — high-level metrics, MITRE coverage heatmaps, behavior type distribution trends. Good for SOC managers and daily pulse-checks.
- Investigation — entity-centric timeline view, built for incident responders who need to drill into a specific user or resource.
- Hunting — anomaly detection overlaid with behaviors, designed for threat hunters doing proactive discovery.
To deploy it: Microsoft Sentinel → Content Hub → search “UEBA essentials” → Save. The workbook is one of the content items in that solution alongside prebuilt hunting queries.
What to watch out for
Cost
Behaviors are stored as Log Analytics records and billed at standard Sentinel ingestion rates. The volume depends entirely on how much raw telemetry you’re ingesting from the supported sources. Before enabling in production, check your current CloudTrail or GCPAuditLogs ingestion volume and estimate how many behavior records that might generate. High-volume sources like active AWS environments can add up quickly.
Single workspace limitation
At GA, this only works on one workspace per tenant. If you have a multi-workspace architecture, choose the workspace that ingests the most relevant non-Microsoft data.
Analytics tier requirement
Behaviors only process data in the Analytics tier. If you’ve moved AWS or GCP logs to the Auxiliary tier for cost reasons, those logs won’t feed the behaviors layer.
Supported vendors only
CommonSecurityLog is a catch-all table. Just because you have a CEF connector sending data doesn’t mean behaviors will fire. Only CyberArk Vault and Palo Alto Threats are supported at this time for CommonSecurityLog.
Why this matters for MSSPs and MDR providers
Running an MSSP or MDR service across a multi-tenant environment, the behaviors layer is particularly interesting because it abstracts away log schema complexity. Your analysts don’t need to memorize every AWS service API or Palo Alto log field — the behavior record gives them the story in plain language, with MITRE context already attached.
For detection engineering, it raises the abstraction level for rule authoring. Instead of writing analytics rules that join multiple raw tables and handle schema variations, you can build on top of BehaviorInfo as a normalized, enriched foundation. That means faster rule development and rules that are easier to explain to clients.
Resources
Microsoft documentation
- Translate raw security logs to behavioral insights using UEBA behaviors in Microsoft Sentinel
- Advanced threat detection with UEBA in Microsoft Sentinel
- Enable entity behavior analytics
- UEBA reference — tables and fields
Tech Community blogs
- Turn complexity into clarity: introducing the new UEBA behaviors layer — GA announcement, January 2026
- Accelerate your UEBA journey: introducing the Microsoft Sentinel behaviors workbook — February 2026
Video
Final thoughts
The UEBA behaviors layer is one of those features that’s easy to overlook because it doesn’t announce itself with a dramatic alert. But it’s doing something genuinely useful: turning high-volume, low-context telemetry from non-Microsoft sources into security-grade intelligence that analysts can actually act on.
If you’re running Sentinel with AWS, GCP, or Palo Alto data, enable it, deploy the workbook, and start building hunting queries on top of it. The normalized behavioral layer is a better foundation for detection than raw logs — and the KQL you write against BehaviorInfo will be cleaner and more maintainable than anything you’d write directly against AWSCloudTrail.
Got feedback or questions about how you’re using the UEBA behaviors layer in your environment? Leave a comment or reach out via the contact page.