


If you’ve been working with Microsoft Defender for Endpoint (MDE) for any length of time, you’ve probably run into this situation: you’re hunting for a specific behavior, you know it happened on a device, but when you query Advanced Hunting, there’s nothing. The event simply isn’t there.
This isn’t a bug. It’s by design. Until recently, your only real options were to deploy Sysmon alongside Defender for Endpoint, managing another agent, another configuration, and a completely different schema.
Custom data collection, which reached general availability in May 2026, gives you a way to collect the specific telemetry you need without those workarounds. This guide covers what problem it actually solves, what it costs, and how to configure it end to end.
The real problem: Defender for Endpoint drops events
Olaf Hartong and the team at FalconForce have done thorough work documenting how Defender for Endpoint works under the hood. Their MDE Internals blog series is required reading for anyone doing detection engineering with Defender.
Here’s the short version:
Defender for Endpoint applies caps and sampling to limit how much telemetry gets uploaded to the cloud. For many event types, you’ll only see one event per 24 hours for each unique combination of field values. Run the same process a hundred times with identical parameters you’ll see it once in Advanced Hunting.
The reason is straightforward. Defender for Endpoint is sold at a fixed price per device. If every customer could upload unlimited telemetry, backend costs would be unpredictable. So Microsoft made a trade-off: enough data for most use cases, but capped volume.
For day-to-day security operations, this is generally fine. The alerts fire, incidents get created, you can investigate. But for custom detections or proactive threat hunting, these gaps become a real problem. A concrete example: malware that beacons to a C2 server every 10 minutes. With standard Defender for Endpoint telemetry, you might see only a handful of connections to that server because once Defender for Endpoint logs the first connection with a specific process/destination combination, duplicate connections don’t appear for 24 hours. The beaconing pattern that would make detection trivial? Invisible.
The table that suffers most is DeviceImageLoadEvents. DLL loads are sampled so aggressively that FalconForce describes it as “very unreliable.” No events in the portal genuinely does not mean nothing happened on the machine.
What custom data collection actually does
Custom data collection lets you define rules that collect specific events and send them to Microsoft Sentinel without the standard Defender for Endpoint caps. The data lands in separate tables so it doesn’t interfere with your normal Defender for Endpoint data.
There is still a limit: 75,000 events per rule, per device, per day (raised from 25,000 at GA). This is a protective cap to prevent runaway costs, not a sampling mechanism. A well-scoped rule will never hit it.
Supported tables:
| Standard MDE table | Custom data collection table |
|---|---|
| DeviceProcessEvents | DeviceCustomProcessEvents |
| DeviceNetworkEvents | DeviceCustomNetworkEvents |
| DeviceFileEvents | DeviceCustomFileEvents |
| DeviceImageLoadEvents | DeviceCustomImageLoadEvents |
| DeviceScriptEvents | DeviceCustomScriptEvents |
One thing worth noting on DeviceScriptEvents: AMSI events from that table are not available in standard Advanced Hunting, but custom collection routes them to DeviceCustomScriptEvents in Sentinel. So for script-based attack detection, custom collection gives you visibility you simply cannot get any other way through the MDE stack.
Notice what’s missing: no registry events, no named pipes, no driver loads. If you need those, you still need Sysmon. Custom data collection is a targeted solution for specific gaps, not a complete replacement.
The custom tables share the same schema as their standard counterparts, with three additional fields: RuleName, RuleLastModificationTime, and Type. These make it easy to identify which rule needs tuning when you’re reviewing results.
Which scenarios are worth implementing
Custom data collection is included with Defender for Endpoint P2, but every event you collect goes to Microsoft Sentinel and gets billed at Sentinel ingestion rates. Before creating any rules, be clear about what gaps you’re actually filling.
High priority usually worth implementing:
| Scenario | Why it matters | Expected volume |
|---|---|---|
| LSASS spawning a child lsass process | Credential dumping technique not logged by default in MDE — use ProcessCreated filtering on lsass.exe as both parent and child | Low — very targeted |
| AMSI script content collection | Script events from DeviceScriptEvents are not available in standard Advanced Hunting at all — the clearest gap custom data collection fills | Medium — scope to specific processes |
| Unsigned DLLs from temp folders | DeviceImageLoadEvents is heavily sampled in standard MDE — DLL side-loading attempts are largely invisible without custom collection | Medium |
| Executions from uncommon locations | Standard MDE deduplicates ProcessCreated after the first unique combination per 24 hours — repeated execution from temp or AppData folders disappears | Medium — broad path list |
| File modifications in sensitive directories | Config tampering, persistence mechanisms, Mimikatz .kirbi ticket files | Low if scoped well |
Advanced use cases worth considering:
| Scenario | Why it matters | Implementation tip |
|---|---|---|
| Web shell detection on web servers | Monitor wwwroot and inetpub for script file creation | Scope to web server device group only |
| Verbose logging during incidents | Temporarily enable broader collection on compromised machines | Use dynamic tags, remove after investigation |
| .NET CLR loads outside framework folder | Detect in-memory .NET execution used by Cobalt Strike and similar | Filter to clr.dll, clrjit.dll, mscoree.dll outside C:\Windows\Microsoft.NET\ |
Approach with caution — can get expensive fast:
| Scenario | Why it’s risky |
|---|---|
| All process creation events | Massive volume, duplicates existing data |
| All network connections | Volume will explode costs |
| All file operations everywhere | You’ll hit the 75,000 event cap and pay a fortune |
| Broad “just in case” rules | Data without purpose is waste |
Prerequisites
Licensing
| Component | Requirement | Notes |
|---|---|---|
| Microsoft Defender for Endpoint | Plan 2 (P2) | Plan 1 does not include custom data collection |
| Microsoft Sentinel | Active workspace | Required for data storage |
| Microsoft 365 license | E5, E5 Security, or standalone MDE P2 | A5/G5 variants also work |
Supported operating systems
| Operating system | Minimum version | Notes |
|---|---|---|
| Windows 11 | Any version | MDE client 10.8805+ required |
| Windows 10 | 1809 or later | ESU enrollment required |
| Windows Server 2022 | Any version | MDE client 10.8805+ required |
| Windows Server 2019 | Any version | MDE client 10.8805+ required |
| Windows Server 2016 | ❌ | |
| Windows Server 2012 R2 | ❌ | |
| macOS | ❌ | |
| Linux | ❌ |
Defender for Endpoint client requirements
| Requirement | Minimum value | How to verify |
|---|---|---|
| Sense client version | 10.8805 or higher | Query DeviceInfo table — see KQL below |
| Real-time protection | Enabled | Required for telemetry collection |
| Cloud-delivered protection | Enabled | Required for backend communication |
Query to check client versions across your environment:
DeviceInfo
| where Timestamp > ago(1d)
| summarize arg_max(Timestamp, *) by DeviceId
| project DeviceName, OSPlatform, OSVersionInfo, ClientVersion
| where ClientVersion < "10.8805"
| order by DeviceName
Portal and permission requirements
| Requirement | Details |
|---|---|
| Defender portal access | security.microsoft.com |
| Required role | Security Administrator, Security Operator, or Global Administrator |
| Sentinel workspace permissions | Contributor or higher on the Log Analytics workspace |
Configuration prerequisites
| Component | Status needed | Where to configure |
|---|---|---|
| Sentinel workspace | Created and active | Azure Portal → Microsoft Sentinel |
| Defender-Sentinel connection | Connected | Defender Portal → Settings → Microsoft Sentinel |
| Dynamic tags | Only required if using tag-based scoping. Must be run at least once before use. Static tags are not supported. | Defender Portal → Settings → Asset rule management |
If you plan to scope rules to specific device groups, configure dynamic tags before creating rules. If you deploy org-wide, you can skip this.
Step 1: Connect your Microsoft Sentinel workspace
Even if you already have Sentinel connected to Defender for other features, you need to explicitly select it for custom data collection.
- Open the Microsoft Defender portal at security.microsoft.com
- Click Settings in the left navigation
- Select Endpoints
- Scroll down to Rules
- Click Custom Data Collection
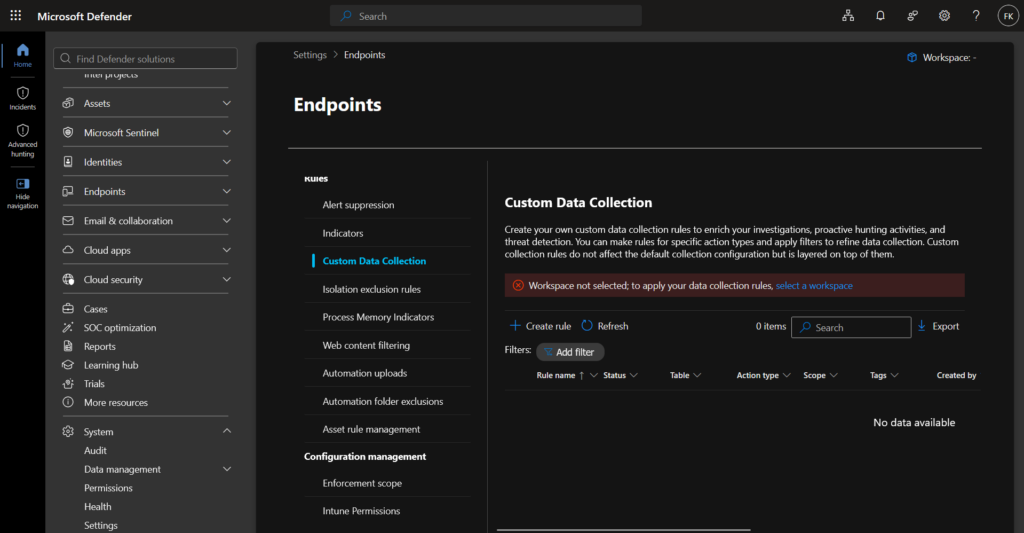
You’ll see the overview page showing any existing rules.
In the top-right corner, click the Microsoft Sentinel workspace dropdown or link, select your workspace from the list, and click Save.
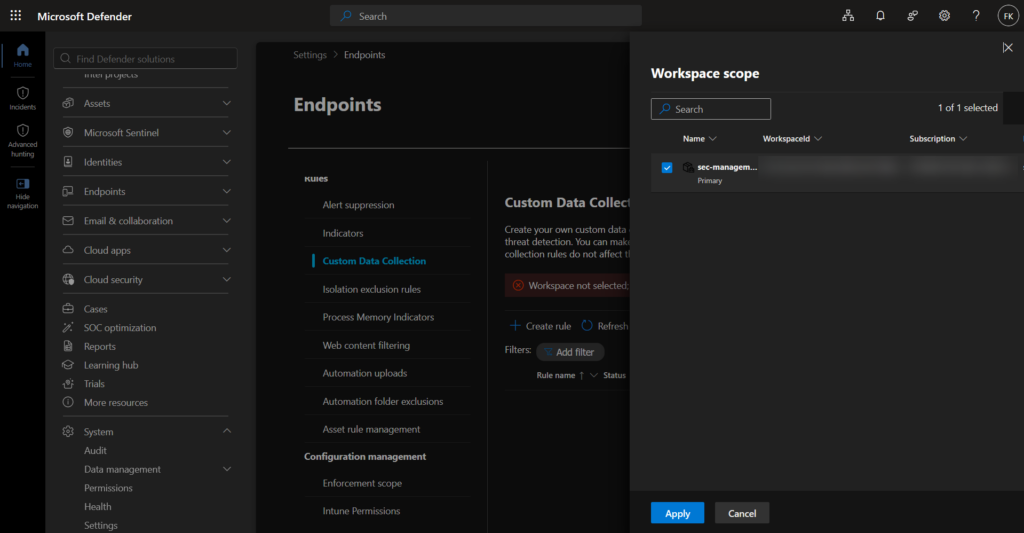
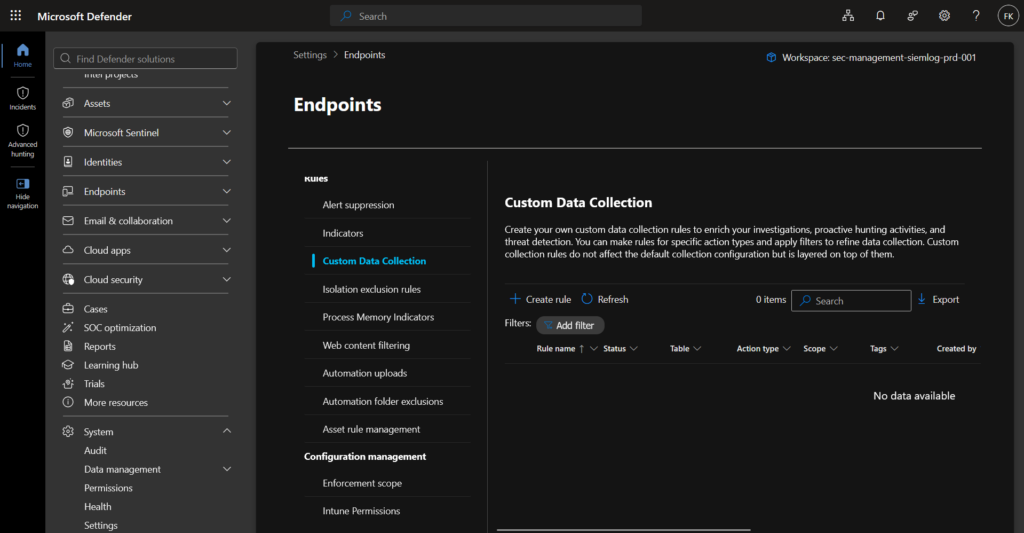
Important limitation: You can only connect one Sentinel workspace per Defender tenant for custom data collection. If you have multiple workspaces, decide which one receives the custom telemetry before you start.
Step 2: Configure dynamic tags
Dynamic tags are needed if you want to scope rules to specific device groups rather than deploying to all devices. If you skip this and choose “all applicable client devices” when creating rules, you can come back and configure tags later when you want more targeted deployment.
Dynamic tags are automatically applied to devices based on rules you define in Asset Rule Management. Unlike static tags, they update as your environment changes.
Create a dynamic tag
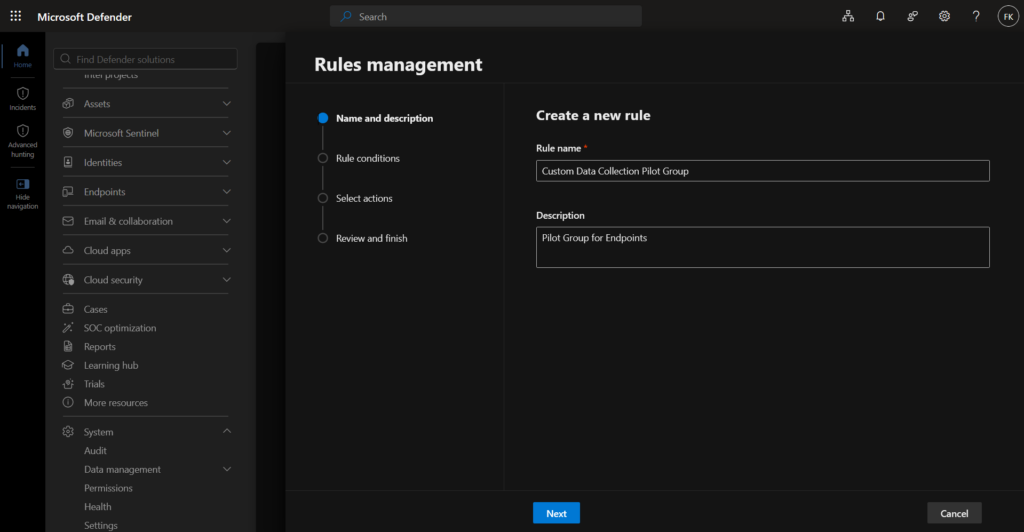
- In the Defender portal, go to Settings → Microsoft Defender XDR
- Click Asset rule management
- Click Create rule
Configure the tag rule
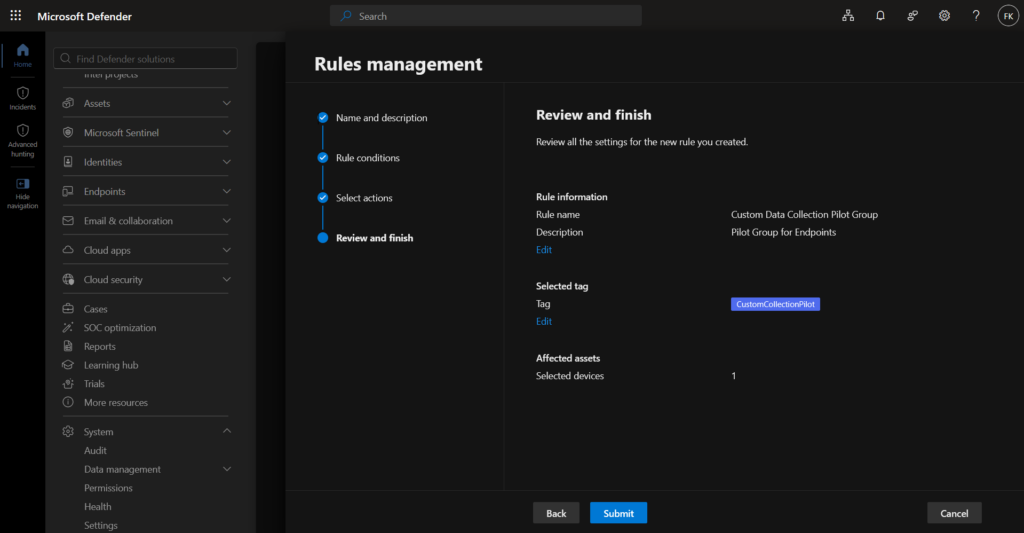
- Rule name: Something descriptive “Custom Data Collection Pilot Group”
- Description: Explain what devices this targets
- Conditions: Define which devices get this tag
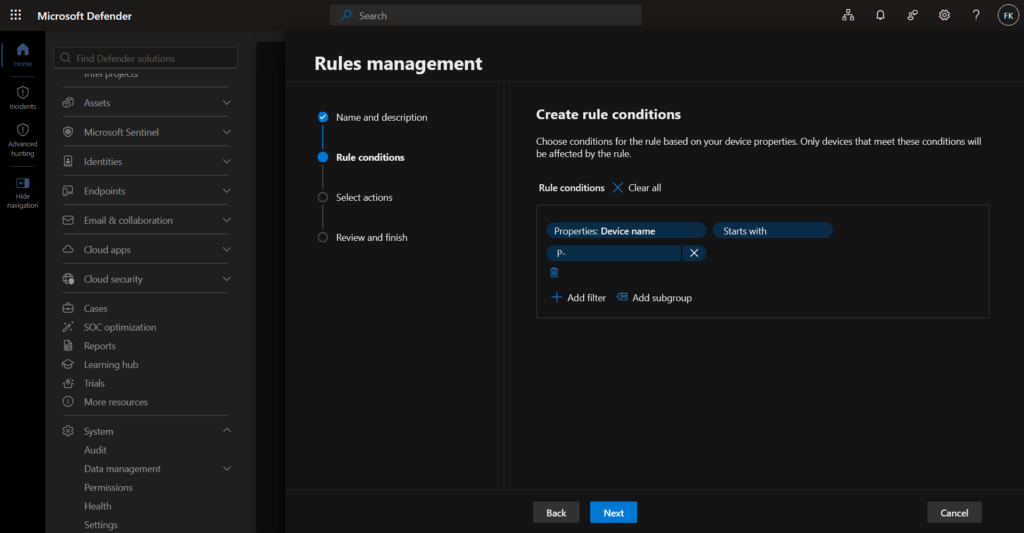
Example conditions:
| Condition type | Operator | Value |
|---|---|---|
| Device name | Contains | “P-“ |
| OS Platform | Equals | “Windows 11” |
| Device group | Equals | “Personal Devices” |
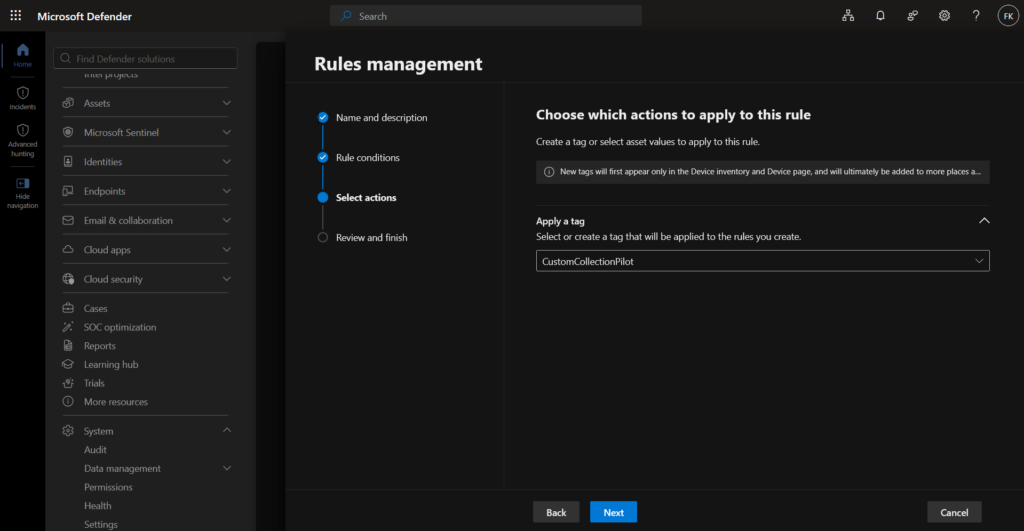
- Tag to apply: Enter the tag name that will be stamped on matching devices e.g., “CustomCollectionPilot”
- Click Submit
Wait for propagation
Dynamic tag rules run approximately every hour. After creating the rule, wait for it to run at least once before using the tag in collection rules. Verify tags are applied by going to Assets → Devices, selecting a device, and checking the Tags field.
Step 3: Create your first custom data collection rule
With your Sentinel workspace connected and your pilot tag ready, create the following rule:
This example uses DeviceScriptEvents with the AmsiScriptContent action type. AMSI script events are not available in standard Advanced Hunting — DeviceScriptEvents is not queryable in the portal without custom data collection. This is exactly the gap the feature is designed to fill: telemetry that MDE collects on the endpoint but never exposes in Advanced Hunting under normal circumstances.
Start the rule wizard
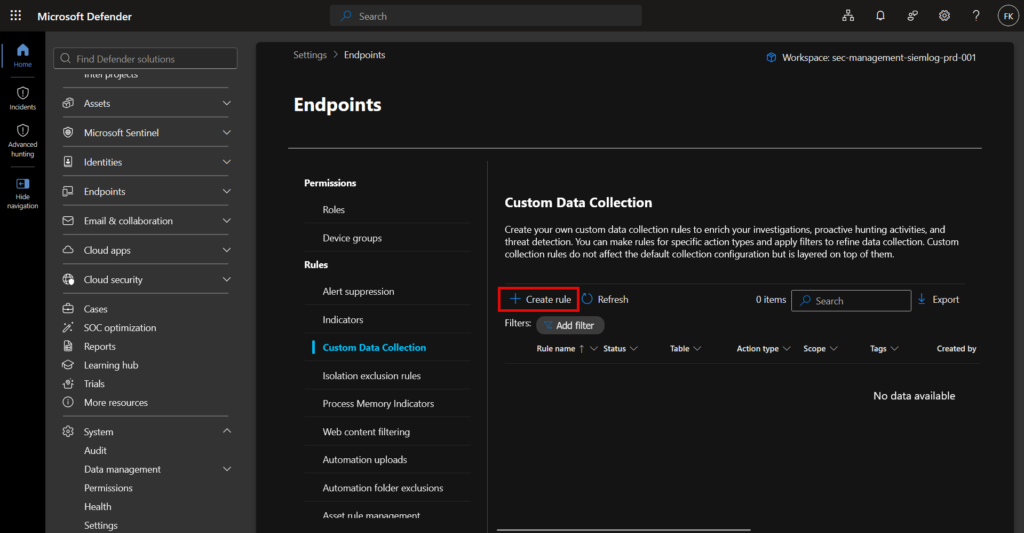
- From the Custom Data Collection page, click Create rule
Configure general information
Enter the following:
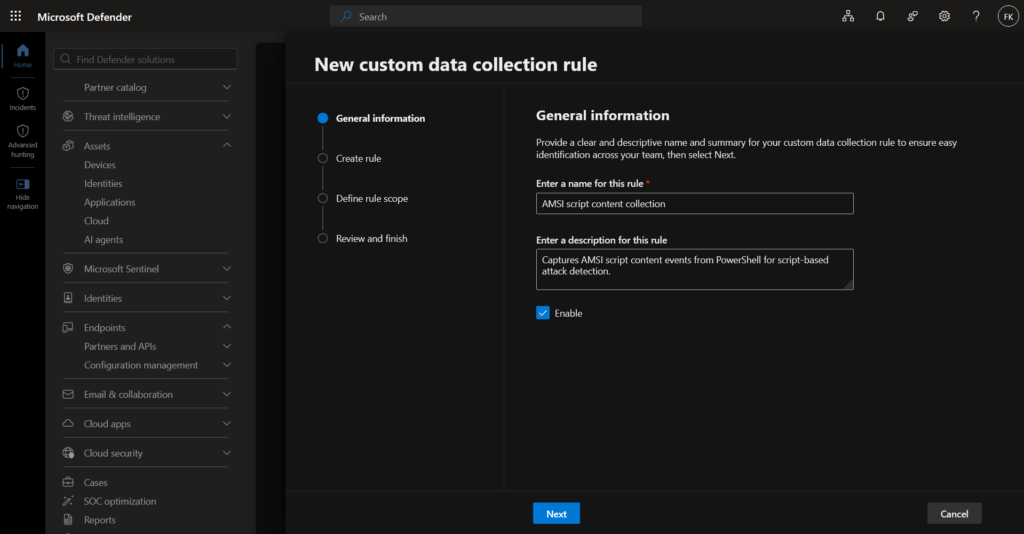
- Rule name: AMSI script content collection
- Description: Captures AMSI script content events from PowerShell for script-based attack detection. DeviceScriptEvents is not available in standard Advanced Hunting.
- Enabled: Toggle ON
- Click Next
Define the collection rule
Configure as follows:
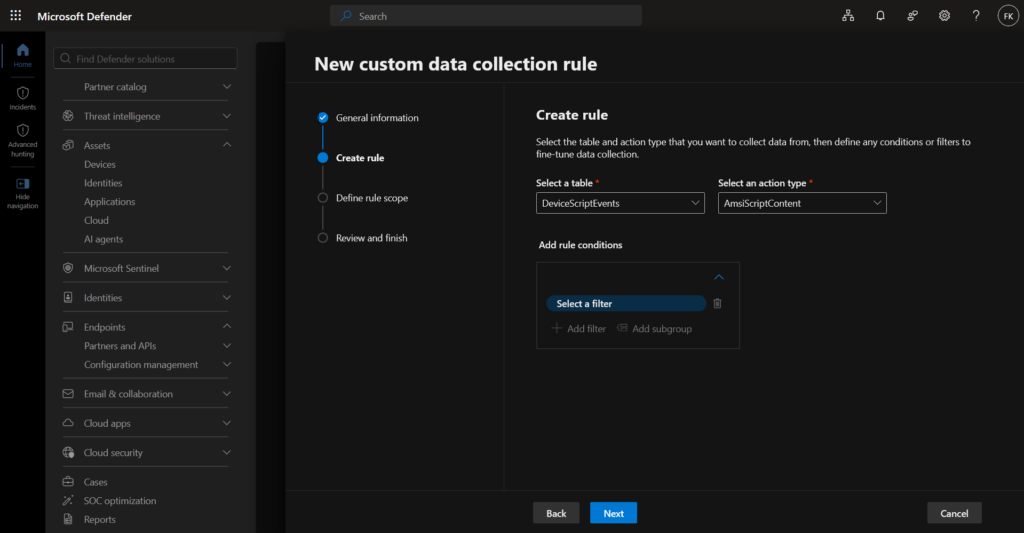
- Table: DeviceScriptEvents
- Action type: AmsiScriptContent
Add filter conditions
Configure the following conditions. The top-level operator is AND, with a subgroup using OR for the command line exclusions.
Top level (AND):
| Source | Operator | Value |
|---|---|---|
| InitiatingProcessSHA1 | Not equals | 1 |
This condition is always true — no real SHA1 hash will ever equal “1”. It serves as a catch-all to collect all events while still satisfying the filter requirement.
Add subgroup (OR) — excludes known MDE-internal scripts:
| Source | Operator | Value |
|---|---|---|
| InitiatingProcessCommandLine | Not equals | “cscript.exe” /nologo “MonitorKnowledgeDiscovery.vbs” |
| InitiatingProcessCommandLine | Does not start with | powershell.exe -ExecutionPolicy AllSigned -NoProfile -NonInteractive -Command “& {OutputEncoding=[Console]::OutputEncoding=[System.Text.Encoding]::UTF8;scriptFileStream |
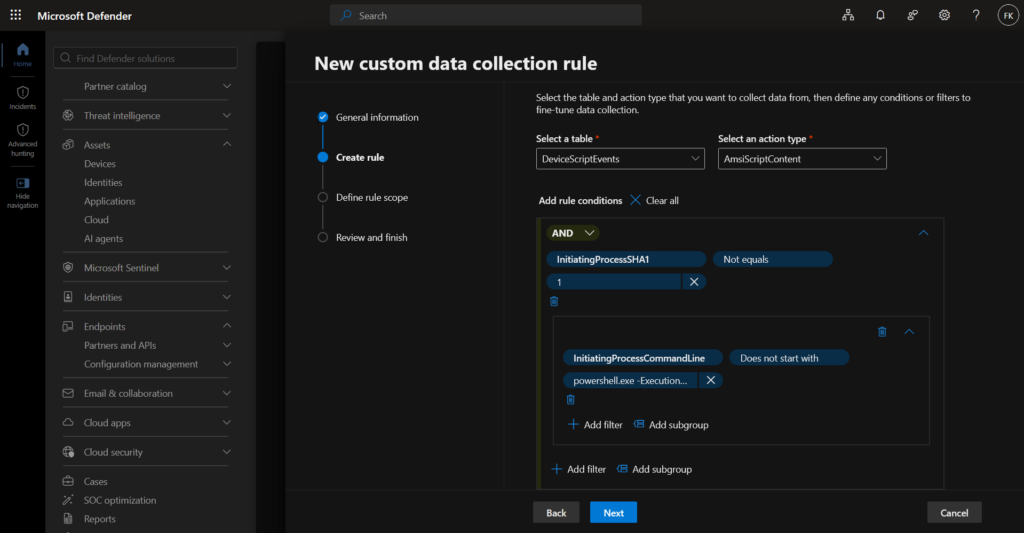
The OR subgroup excludes two known MDE-native script executions that would otherwise generate noise. Add further exclusions here as you identify other internal processes in your environment.
Define rule scope
The portal gives you two options:
All applicable client devices — deploys to every Windows device enrolled in Defender for Endpoint. Corresponds to scope: Organization in TelemetryCollectionManager. Simple to configure but highest potential cost, so only use this for critical rules you genuinely need everywhere.
Specific devices that include dynamic tags — deploys only to devices with the selected tag. Use this for testing, cost control, or scenario-specific monitoring such as web servers or domain controllers.
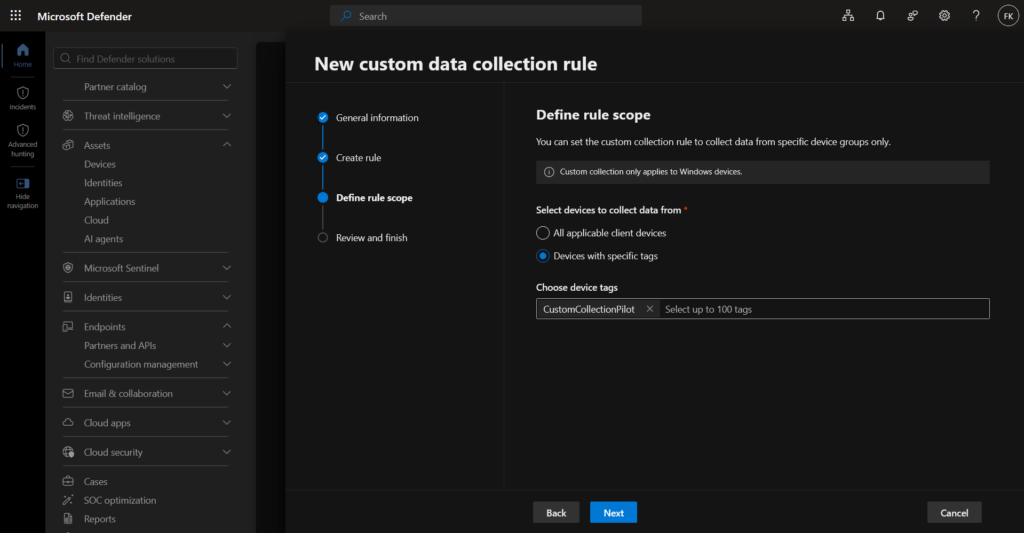
If you choose tag-based scoping, the tags must be dynamic (configured in Asset Rule Management), not manual static tags.
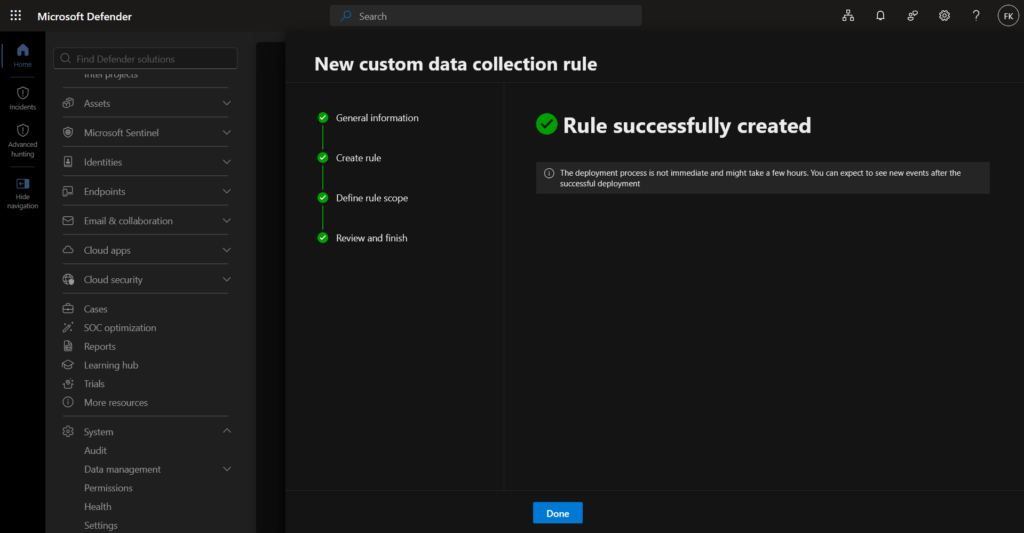
Click Next, review your settings, then click Submit.
Deployment timeline: Rules take 20 minutes to 1 hour to propagate to devices.
Step 4: Verify data is flowing
After creating rules and waiting for deployment, verify everything works.
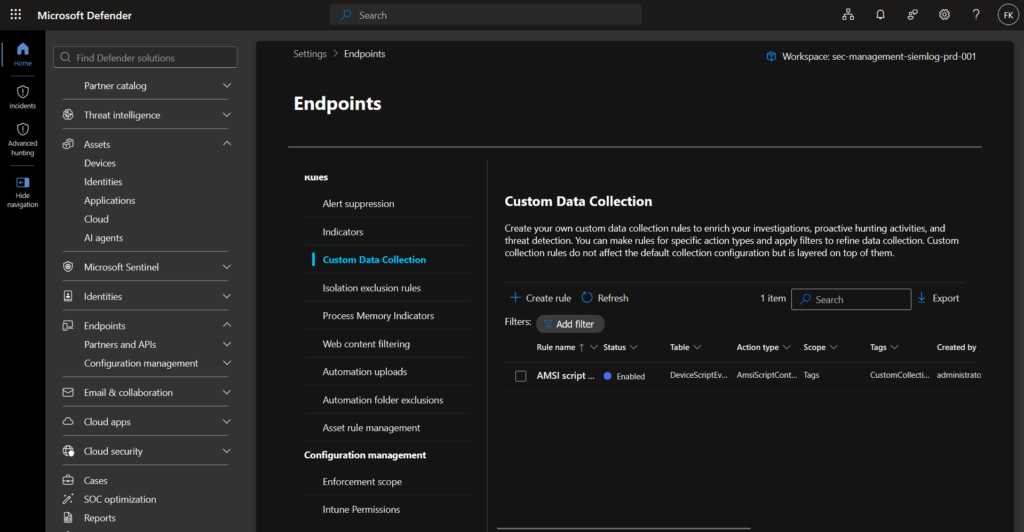
Check rule status
Go to Settings → Endpoints → Rules → Custom Data Collection, find your rule, and confirm the status column shows Enabled.
Query custom tables in Advanced Hunting
Check for any events from your rules:
DeviceCustomScriptEvents
| where TimeGenerated > ago(1h)
| where RuleName == "AMSI script content collection"
| take 10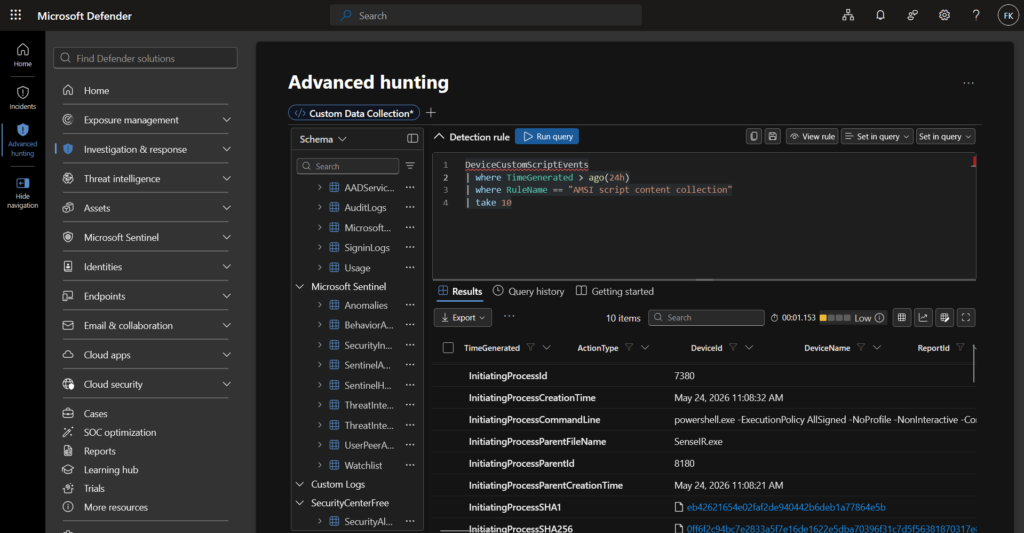
What if no data appears?
Wait at least 1 hour after rule creation before troubleshooting. If still no data:
- Verify client version: Query
DeviceInfofor your test devices needs to be 10.8805 or higher - Check tag assignment: Verify the device has the dynamic tag applied
- Broaden your rule temporarily: Create a rule with minimal filters to see if anything flows at all
- Reboot a test device: Sometimes the Defender for Endpoint service needs a restart to pick up new rules
Step 5: Build detections on custom tables
Now that data is flowing, create an analytics rule in Sentinel to detect suspicious script content.
Create an analytics rule in Sentinel
- In the Microsoft Defender portal at security.microsoft.com
- Navigate to Microsoft Sentinel in the left navigation
- Select your workspace
- Go to Analytics → Create → Scheduled query rule
Configure the rule
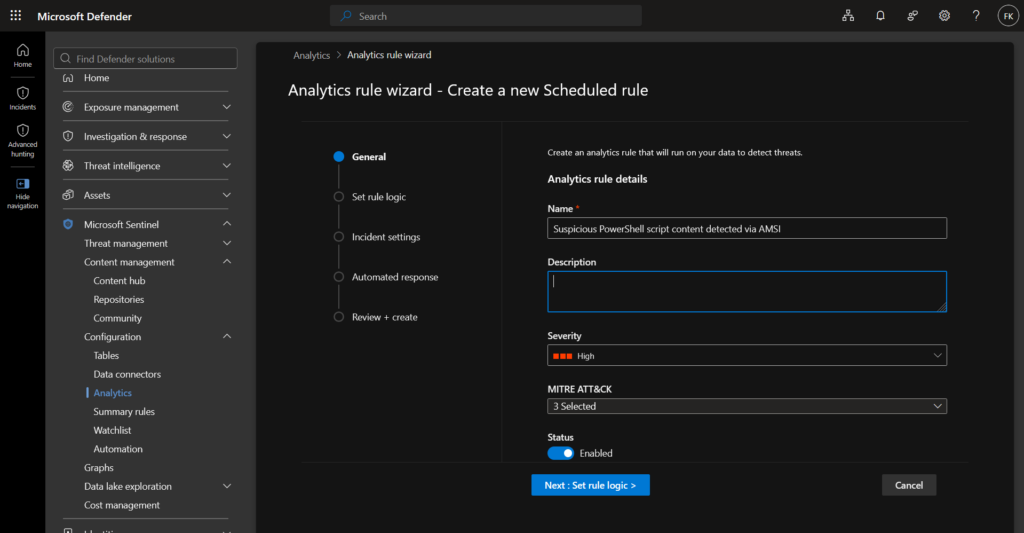
General tab:
- Name: Suspicious PowerShell script content detected via AMSI
- Severity: High
- MITRE ATT&CK: T1059.001 – PowerShell
Rule logic tab:
DeviceCustomScriptEvents
| where RuleName == "AMSI script content collection"
| where ScriptContent has_any (
    "IEX",
    "Invoke-Expression",
    "DownloadString",
    "DownloadFile",
    "FromBase64String",
    "Invoke-Mimikatz",
    "Invoke-Shellcode",
    "Invoke-ReflectivePEInjection",
    "AmsiUtils",
    "-EncodedCommand",
    "-enc "
)
| project
    TimeGenerated,
    DeviceName,
    InitiatingProcessFileName,
    InitiatingProcessAccountName,
    InitiatingProcessCommandLine,
    ScriptContent,
    ScriptContentSHA256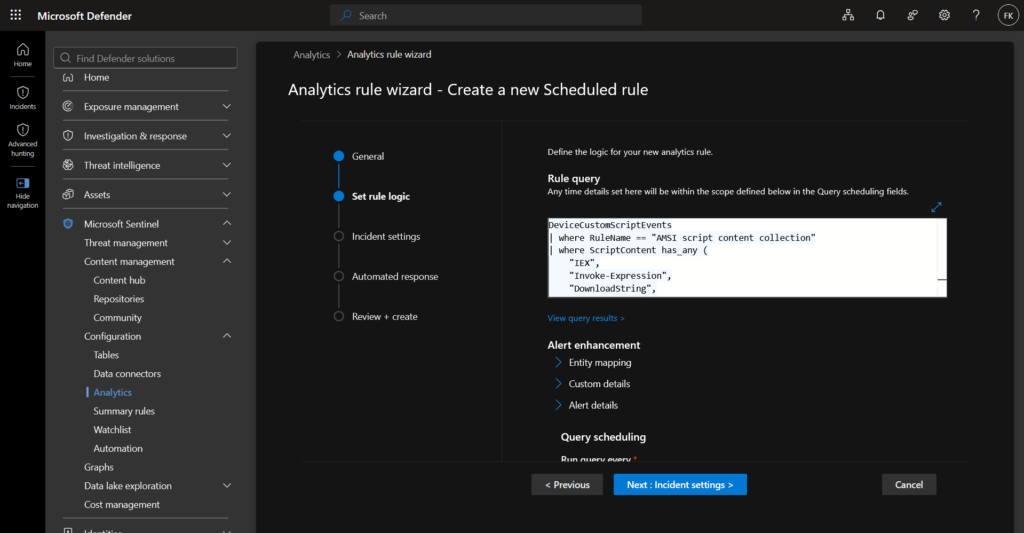
ScriptContent contains the decoded script text captured by AMSI — what the script actually does, regardless of how it was obfuscated on the command line. ScriptContentSHA256 lets you pivot to other devices where the same script was executed, which is useful during incident response.
- Run query every: 5 minutes
- Lookup data from: Last 5 minutes
- Alert threshold: Greater than 0
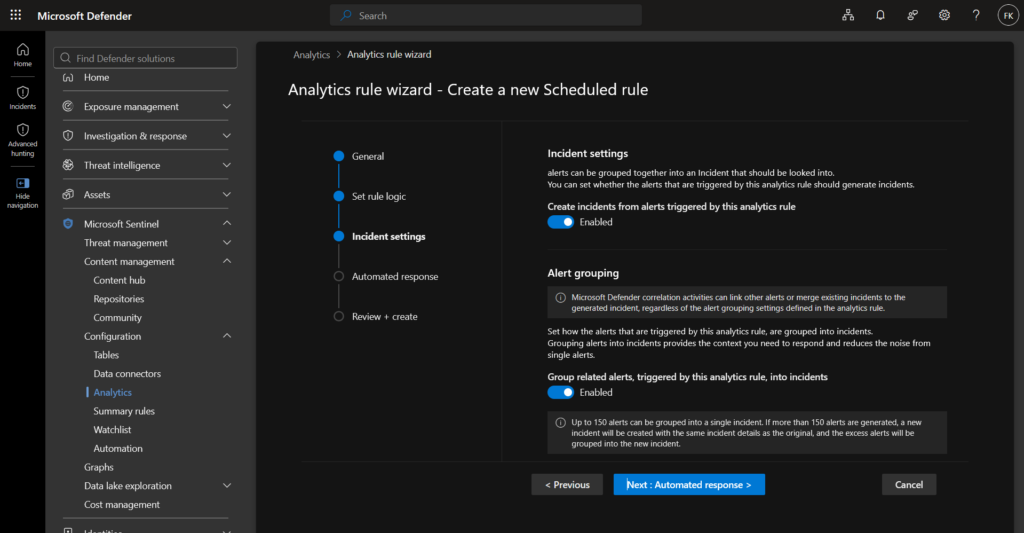
Incident settings:
Enable incident creation. Group alerts by DeviceName so multiple suspicious script executions on the same device create one incident.
Managing rules at scale with TelemetryCollectionManager
If you followed the walkthrough in Step 3, you already experienced what building a single rule in the portal feels like: click through the wizard, add filter conditions one line at a time, one value per line, no way to paste a list, no validation until you submit. For one rule that’s manageable. For ten rules across five device groups, it becomes a real operational problem.
There is no bulk import, no version history, no way to review what changed between last Tuesday and today, and no way to roll back a misconfigured rule without manually recreating it. If a colleague builds a rule and you need to understand what it does, you open the portal, find the rule, and click through the wizard read-only. There is no export to a readable format.
FalconForce released TelemetryCollectionManager to solve exactly this. It is a CLI tool that lets you define rules as YAML files, validate them against the MDE schema locally, and deploy them via the Defender API. Your Git repository becomes the single source of truth — rules are reviewed before deployment, changes are tracked, and rollback is a git revert.
Benefits:
| Benefit | Description |
|---|---|
| Version control | Track changes, roll back mistakes |
| Code review | Review rules before deployment |
| Bulk operations | Deploy multiple rules at once |
| Validation | Catch errors before they hit production |
| IntelliSense | VSCode autocomplete with included schema |
Installation
Download from GitHub: FalconForceTeam/TelemetryCollectionManager. Releases available for Windows, macOS, and Linux.
All rules in the repository are disabled by default review and enable what’s appropriate for your environment before deploying.
Basic usage
Step 1: Set up your rules directory
rules/
├── lsass-access.yaml
├── unsigned-dll-loads.yaml
├── non-standard-ports.yaml
└── powershell-unusual-location.yaml
Step 2: Validate rules locally
./TelemetryCollectionManager --validate-onlyStep 3: Authenticate
The tool requires a user-based token. There is currently no support for service principals, managed identities, or app registrations — this is an API limitation on Microsoft’s side, not a tool limitation. The two options are:
Option A: Azure CLI (recommended)
az login
# Tool automatically uses your session
Option B: Manual bearer token (if Azure CLI is not an option)
export AZURE_TOKEN="your-token-here"
# Retrieve via browser developer tools: Defender portal > F12 > Network > filter getToken?resource=MATP
Step 4: Deploy rules
./TelemetryCollectionManager --post-rulesStep 5: List existing rules
./TelemetryCollectionManager --list-rulesStep 6: Delete rules (use with care)
# Delete specific rules
./TelemetryCollectionManager --delete-rules "rule-id-1,rule-id-2"

# Delete ALL rules
./TelemetryCollectionManager --delete-rules=all
TelemetryCollectionManager also supports converting existing portal rules to YAML — useful if you built rules in the portal before adopting the tool. Check the README for the exact flag.
YAML schema reference
Basic structure:
# yaml-language-server: $schema=../rule-schema.json
name: Rule name here
description: What this rule does and why
enabled: true
platform: Windows
scope: Organization
table: DeviceProcessEvents
actionType: ProcessCreated
filters:
  operator: And
  expressions:
    - filter: Equals
      source: FileName
      values: ["example.exe"]
The scope field accepts Organization to deploy the rule to all applicable client devices, which is the equivalent of the “all applicable client devices” option in the portal wizard. To target a specific device group instead, replace it with the name of your dynamic tag — for example scope: CustomCollectionPilot. Static tags are not supported; if you use tag-based scoping it must be a dynamic tag configured in Asset Rule Management.
Nested logic example — PowerShell from a suspicious location, excluding a known management tool:
filters:
  operator: And
  expressions:
    - group:
        operator: Or
        expressions:
          - filter: Contains
            source: FolderPath
            values: ["\\temp\\"]
          - filter: Contains
            source: FolderPath
            values: ["\\downloads\\"]
    - filter: NotEquals
      source: InitiatingProcessFileName
      values: ["ManagementTool.exe"]
Practical rule examples
The following five rules are taken directly from the TelemetryCollectionManager repository, authored by FalconForce. All ship disabled by default which is really awesome — review and enable what fits your environment 🙂
Example 1: lsass starting lsass
An attack technique where lsass.exe forks and spawns another instance of itself, commonly used to dump credentials from memory. This process creation event is not logged by default in MDE — making it a textbook case for custom data collection. Look for InitiatingProcessParentFileName not being werfault.exe when hunting results.
# yaml-language-server: $schema=../rule-schema.json
name: lsass_starting_lsass
description: An attack technique where lsass.exe 'forks' and spawns another instance of itself, often used to dump credentials. Look for the InitiatingParentProcessFileName not being werfault.exe. This is not logged by default in MDE.
enabled: false
platform: Windows
scope: Organization
table: DeviceProcessEvents
actionType: ProcessCreated
filters:
    operator: And
    expressions:
        - source: FileName
          filter: Contains
          values:
            - lsass.exe
        - source: InitiatingProcessFileName
          filter: Contains
          values:
            - lsass.exe
Example 2: Executions from uncommon locations
Malware staging and living-off-the-land attacks frequently execute processes from user-writable locations like temp folders, AppData, Downloads, or Desktop.
# yaml-language-server: $schema=../rule-schema.json
name: executions_from_uncommon_locations
description: Processes executing from uncommon locations such as temp folders or user profile paths. MDE logs only 1 attempt per process, so this rule will show the repeated executions of the same process.
enabled: false
platform: Windows
scope: Organization
table: DeviceProcessEvents
actionType: ProcessCreated
filters:
    operator: Or
    expressions:
        - source: FolderPath
          filter: Contains
          values:
            - 'C:\PerfLogs\'
            - 'C:\$Recycle.bin\'
            - 'C:\Users\Default'
            - 'C:\Users\Public\'
            - '\Temp\'
            - 'C:\Windows\Prefetch\'
            - '\AppData\Local\'
            - '\AppData\Roaming\'
            - '\Local Settings\Temp\'
            - '\Temporary Internet Files\'
            - 'C:\Windows\Fonts\'
            - 'C:\Windows\Media\'
            - 'C:\Windows\Help\'
            - '\htdocs\'
            - '\wwwroot\'
            - '\Downloads\'
            - '\Desktop\'
Example 3: .NET CLR loaded outside .NET framework folder
DeviceImageLoadEvents is heavily sampled in standard MDE. Loading .NET CLR DLLs (clr.dll, clrjit.dll, mscoree.dll) from processes outside the .NET framework folder is a strong indicator of in-memory .NET assembly execution — used by Cobalt Strike, execute-assembly techniques, and similar post-exploitation frameworks. Without custom collection, these DLL loads are largely invisible.
# yaml-language-server: $schema=../rule-schema.json
name: dotnet_clr_loaded
description: The .NET CLR DLLs being loaded by processes outside of the .NET framework folder, which may indicate assemblyloads into injected processes. Tune based on your environment to reduce noise.
enabled: false
platform: Windows
scope: Organization
table: DeviceImageLoadEvents
actionType: ImageLoaded
filters:
  operator: And
  expressions:
    - source: FileName
      filter: Contains
      values:
        - clr.dll
        - clrjit.dll
        - mscoreei.dll
        - mscoree.dll
        - mscorlib.dll
        - mscoreeis.dll
        - mscorlib.ni.dll
    - source: InitiatingProcessFolderPath
      filter: NotContains
      values:
        - 'C:\Windows\Microsoft.NET\'
Example 4: Rundll32 loading comsvcs.dll for minidump
rundll32.exe loading comsvcs.dll with MiniDump in the command line is a classic post-exploitation credential dump technique — it creates a memory dump of LSASS without using dedicated tooling. Again, DeviceImageLoadEvents is where standard MDE telemetry fails; this specific DLL load pattern may never appear in standard Advanced Hunting.
# yaml-language-server: $schema=../rule-schema.json
name: rundll32_minidump
description: Rundll32 loading comsvcs.dll to create a minidump, often used in post-exploitation activity.
enabled: false
platform: Windows
scope: Organization
table: DeviceImageLoadEvents
actionType: ImageLoaded
filters:
  operator: And
  expressions:
    - source: FileName
      filter: Contains
      values:
        - comsvcs.dll
    - source: InitiatingProcessFileName
      filter: Equals
      values:
        - rundll32.exe
    - source: InitiatingProcessCommandLine
      filter: Contains
      values:
        - MiniDump
Example 5: Kirbi file creation
.kirbi files are Kerberos ticket files created by Mimikatz during credential theft operations (sekurlsa::tickets /export or kerberos::list /export). Their presence on disk is essentially unambiguous — there is no legitimate reason for .kirbi files to be created in normal operations.
# yaml-language-server: $schema=../rule-schema.json
name: kirbi_file_creation
description: Kirbi file creation detection, often used by Mimikatz for credential dumping.
enabled: true
platform: Windows
scope: Organization
table: DeviceFileEvents
actionType: FileCreated
filters:
    operator: Or
    expressions:
        - source: FolderPath
          filter: EndsWith
          values:
            - .kirbi
See the rest of the rules here
Understanding the costs
What’s included vs extra
| Component | Cost |
|---|---|
| Custom data collection feature | Included with Defender for Endpoint P2 |
| Data ingestion to Sentinel | Charged per GB |
Sentinel pricing (approximate, varies by region)
| Tier | Price per GB |
|---|---|
| Pay-as-you-go | ~€4.30–5.20 |
| 100 GB/day commitment | ~€3.40 effective |
| 500 GB/day commitment | ~€2.96 effective |
Always verify current pricing at aka.ms/sentinelpricing these figures shift with regional pricing updates.
Cost calculation example
| Factor | Value |
|---|---|
| Endpoints | 1,000 devices |
| Events per device/day | 500 average |
| Event size | ~2 KB each |
| Daily volume | 1,000 × 500 × 2 KB = 1 GB/day |
| Monthly cost (PAYG) | 30 × €5 = ~€150/month |
That’s manageable. The risk is broad rules:
| Scenario | Daily volume | Monthly cost |
|---|---|---|
| Targeted rules (500 events/device) | 1 GB | ~€150 |
| Moderate rules (2,000 events/device) | 4 GB | ~€600 |
| Broad rules (10,000 events/device) | 20 GB | ~€3,000 |
Cost optimization tips
- Start narrow begin with specific filters, expand only if needed
- Scope to device groups don’t collect from every device if not necessary
- Monitor ingestion: use Sentinel’s Usage workbook regularly
- Remove unused rules if nobody queries the data, delete the rule
- Consider commitment tiers if collecting >100 GB/day, commit for savings
Custom data collection vs Sysmon
For years, Sysmon has been the go-to solution for filling MDE’s telemetry gaps. When MDE didn’t give you DLL loads, you added Sysmon. When you needed registry events for persistence detection, Sysmon. Named pipes, driver loads, WMI events — Sysmon covered what MDE didn’t. The trade-off was always the operational overhead: a separate agent to deploy, a separate XML configuration to maintain, a separate data schema to write detections against, and a log collection agent on top of that to get the events into Sentinel.
Custom data collection changes that trade-off significantly. Process, file, network, and image load events now have a native MDE solution that uses the same schema you already query in Advanced Hunting, deploys without an additional agent, and integrates directly with Sentinel. For many organizations, this is enough to remove Sysmon entirely or at least substantially reduce its scope.
Honestly, you probably still need both.
Comparison
| Aspect | Custom data collection | Sysmon |
|---|---|---|
| Deployment | Built into Defender for Endpoint | Separate agent + config |
| Management | Portal or API | XML files |
| Data schema | MDE tables | Sysmon events |
| Process events | ✅ | ✅ |
| File events | ✅ | ✅ |
| Network events | ✅ | ✅ |
| Image/DLL loads | ✅ | ✅ |
| Registry events | ❌ | ✅ |
| Named pipes | ❌ | ✅ |
| Driver loads | ❌ | ✅ |
| WMI events | ❌ | ✅ |
Recommendation
Use a hybrid approach:
- Custom data collection for process, file, network, and DLL events where you need complete visibility
- Sysmon slimmed down to registry, pipe, and driver events only
This reduces Sysmon’s footprint while maintaining visibility that custom data collection can’t provide.
Alternative for DLL loads only:
If you only need reliable DLL load telemetry without the full custom data collection setup, consider WDACme a WDAC audit-mode policy that generates CodeIntegrity events for specified DLLs in the DeviceEvents table. That said, custom data collection is more flexible and easier to manage at scale.
Troubleshooting common issues
No events appearing
| Check | Solution |
|---|---|
| Time elapsed | Wait at least 1 hour after rule creation |
| Client version | Must be 10.8805+ check DeviceInfo table |
| Rule enabled | Verify rule shows “Enabled” in portal |
| Device in scope | Verify device has the dynamic tag applied |
| Filters too narrow | Test with a broader rule temporarily |
| Custom collection not initializing | Check for EDR exclusions on target paths or processes; reboot the device if collection isn’t starting |
Hitting the 75,000 event cap
Your rule is too broad. Solutions:
- Add more specific filters
- Scope to fewer devices
- Split into multiple targeted rules
Events in wrong table
Custom data collection uses DeviceCustom* tables, not standard Device* tables:
// Wrong - standard table
DeviceProcessEvents | where ...

// Right - custom table
DeviceCustomProcessEvents | where ...
Rule not deploying to device
- Verify device meets OS and client version prerequisites
- If using dynamic tags, verify the tag is applied to the device and the tag rule has run in Asset Rule Management
- Try rebooting the device
Useful diagnostic query
search in (DeviceCustomProcessEvents, DeviceCustomNetworkEvents, DeviceCustomFileEvents, DeviceCustomImageLoadEvents, DeviceCustomScriptEvents) *
| where DeviceId == "your-device-id"
| where TimeGenerated > ago(24h)
| summarize EventCount = count() by RuleName, $table
| order by EventCount desc
References
- Microsoft Learn: Custom data collection in Defender for Endpoint
- Microsoft Learn: Create custom data collection rules
- FalconForce: MDE Internals 0x06 – Custom Collection
- FalconForce: MDE Internals 0x03 – Telemetry Unreliability
- FalconForce: MDE Internals 0x01 – Sysmon vs MDE
- GitHub: FalconForce TelemetryCollectionManager
- GitHub: WDACme – DLL load telemetry workaround
- Microsoft Sentinel pricing
- Configure dynamic rules for devices
Conclusion
Custom data collection fills a real gap that detection engineers working with Defender for Endpoint have dealt with for years. The event capping in standard telemetry isn’t going away it’s a structural trade-off in how MDE is priced and operated. This feature gives you a legitimate, supported path to collect the specific events you actually need, without bolting on another agent or working around the schema.
That said, it’s not a fire-and-forget feature. Every rule you create is an ongoing cost, and broad rules will surface that cost quickly. The organizations that get the most value from this are the ones that start from a concrete detection gap a technique they couldn’t detect reliably, a table they knew was being sampled and work backwards to the minimum rule that closes it.
The hybrid approach with Sysmon still makes sense for most environments. Custom data collection covers process, file, network, and DLL events well. Sysmon still wins on registry, pipes, and driver loads. Using both, scoped appropriately, gives you more complete coverage than either alone.