
Introduction
What is Microsoft Sentinel data lake
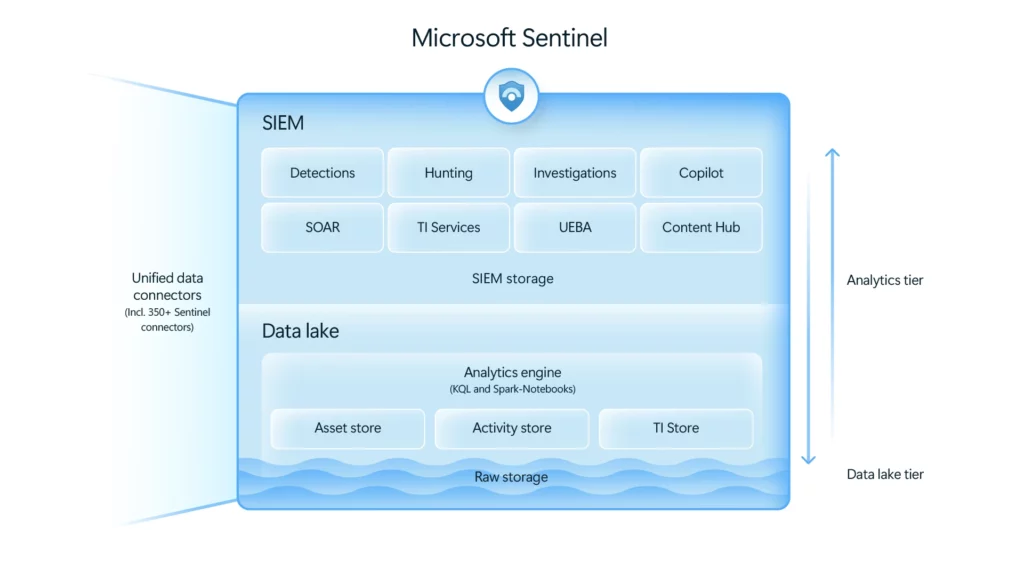
Microsoft Sentinel data lake is a purpose-built, cloud-native security data platform that addresses the fundamental challenge organizations face between comprehensive security coverage and cost sustainability. The platform transforms how organizations manage and analyze security data through:
- Unifying security data across Microsoft Defender XDR, third-party sources, assets, activity logs, and threat intelligence
- Optimizing costs with tiered storage, on-demand data promotion, and single copy architecture
- Enabling deep security insights with up to 12 years of queryable security data
- Powering AI and automation for faster detection and response
The business challenge solved
Traditional SIEM solutions struggle with the cost and complexity of storing and querying long-term security data. Organizations often face impossible choices between comprehensive security coverage and budget constraints. Microsoft Sentinel data lake solves these challenges through centralized data management, cost-effective storage with significantly lower per-GB costs for historical data, maintained query capabilities ensuring no loss of analytical functionality, and automated data lifecycle management reducing operational overhead.
Two-tier architecture benefits

Microsoft Sentinel data lake implements a sophisticated two-tier architecture optimized for both cost and performance:
| Feature | Analytics tier | Data lake tier |
|---|---|---|
| Key characteristics | High-performance querying and indexing (hot/interactive retention) | Cost-effective long-term retention (cold storage) |
| Best use cases | Real-time analytics rules, alerting, hunting, workbooks, all Sentinel SIEM features | Compliance and regulatory logging, historical trend analysis and forensics, low-touch data not needed for real-time alerts |
| Query price included | Yes – queries included in ingestion cost | No – queries charged separately at $0.005/GB scanned |
| Query performance | Optimized – sub-second response for recent data | Slower – optimized for large-scale scans, good for auditing |
| Query capabilities | Full KQL in Defender and Azure portals via APIs | Full KQL on single table with lookup enrichment, scheduled KQL/Spark jobs, Jupyter notebooks |
| Real-time analytics features | Yes – all detection rules, alerts, workbooks, hunting queries | No – limitations on analytics rules, hunting queries, parsers, watchlists, workbooks, playbooks |
| Search jobs | Supported | Supported |
| Summary rules | Supported | Supported – Full KQL on single table, extendable with analytics table lookups |
| Restore capability | Supported | Not supported |
| Data export | Supported | Not supported |
| Retention period | 90 days (Sentinel) / 30 days (Defender XDR), extendable to 2 years with prorated monthly charge | Same as analytics by default, extendable to 12 years |
Critical Note: Data processing charge ($0.10/GB) applies ONLY to data ingested directly to data lake tier only. Data mirrored from analytics tier incurs NO processing charge.
Key advantages over Azure Data Explorer (ADX)
While Azure Data Explorer remains a powerful platform, it demands significant administrative investment. Organizations using ADX must manually create and maintain table structures, custom functions, monitoring systems, and data mappings. The Sentinel data lake eliminates this operational burden by having Microsoft handle the underlying infrastructure management.
Impact on Auxiliary logging
When organizations enable the Sentinel data lake, auxiliary log tables automatically disappear from both Defender Advanced Hunting and the Microsoft Sentinel portal interface. However, this data isn’t lost—it’s seamlessly migrated to the data lake environment where analysts can access it through KQL queries or Jupyter notebooks. This transition represents an automatic upgrade from auxiliary table storage to a more scalable data lake architecture.
Prerequisites and requirements
Required permissions
You need specific roles across different scopes:
| Permission Scope | Required Role | Purpose |
|---|---|---|
| Azure Subscription | Subscription Owner | Billing setup and resource creation |
| Microsoft Entra ID | Global Administrator OR Security Administrator | Cross-tenant security platform configuration |
| Workspace Level | Microsoft Sentinel Reader | Access to all participating workspaces |
Technical prerequisites
Infrastructure requirements:
- Existing Azure subscription with billing access
- Resource group (existing or new) – cannot be changed after setup
- Microsoft Sentinel workspace(s) in correct region
- Microsoft Sentinel primary workspace is connected to the Microsoft Defender XDR portal
Pricing model
Understanding the cost structure of Microsoft Sentinel data lake is essential for planning your implementation and maximizing cost savings. The platform uses a consumption-based pricing model with distinct meters for ingestion, storage, processing, and compute.
The pricing model underwent changes as the platform transitioned from public preview to general availability. Most notably, data processing and asset data ingestion now incur charges, though these costs are offset by the substantial savings on storage and the elimination of analytics tier ingestion costs for appropriately routed data.
Current pricing structure
| Cost component | Rate | What it covers |
|---|---|---|
| Data lake ingestion | $0.05/GB | Data entering data lake tier directly |
| Data processing | $0.10/GB | All transformations (filtering, normalization, enrichment) |
| Data lake storage | $0.026/GB/month | Storage beyond 30-day included period (6:1 compression applied) |
| Query execution | $0.005/GB | Data scanned during KQL queries and jobs |
| Jupyter notebook compute | $0.15/compute hour | Notebook sessions (cores × session time) |
| Asset data ingestion | $0.05/GB | Entra ID, Microsoft 365, and Azure asset connector data |
For comparison – Analytics tier: $2.30-$4.60/GB ingestion (region and commitment dependent)
Critical pricing notes
Included with ingestion:
- 30 days of storage included – No separate storage charges for first 30 days
- No double billing – Data mirrored from analytics tier to data lake incurs no additional ingestion charges
Sentinel-specific advantage:
- Filtering exemption – Sentinel workspaces have NO penalty charges for DCR filtering, regardless of volume reduction percentage (Standard Log Analytics charges penalties for filtering >50%)
Uniform compression:
- 6:1 compression ratio – Applied consistently across all data sources for storage billing
October 2025 changes:
- Data processing ($0.10/GB) – Now charged (was free during preview)
- Asset data ingestion ($0.05/GB) – Now charged (was free during preview)
Data lake onboarding
Step 1: Initiate onboarding process
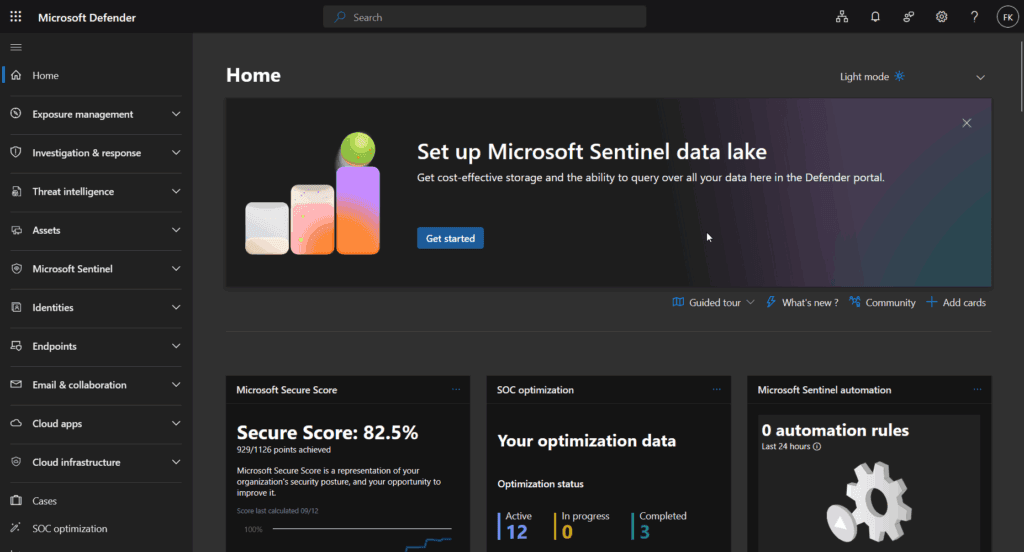
Method 1: Via onboarding banner
- Sign in to Microsoft Defender Portal
- Look for data lake onboarding banner at top of page
- Click Get started
Method 2: Via settings navigation
- Navigate to System → Settings → Microsoft Sentinel → Data lake
- Click Set up data lake
Step 2: Permission validation screen
If you encounter the permissions screen, refer to the requirements above for required permissions.
Step 3: Billing configuration
- Subscription: Choose billing subscription carefully
- Resource group: Select or create resource group for data lake resources
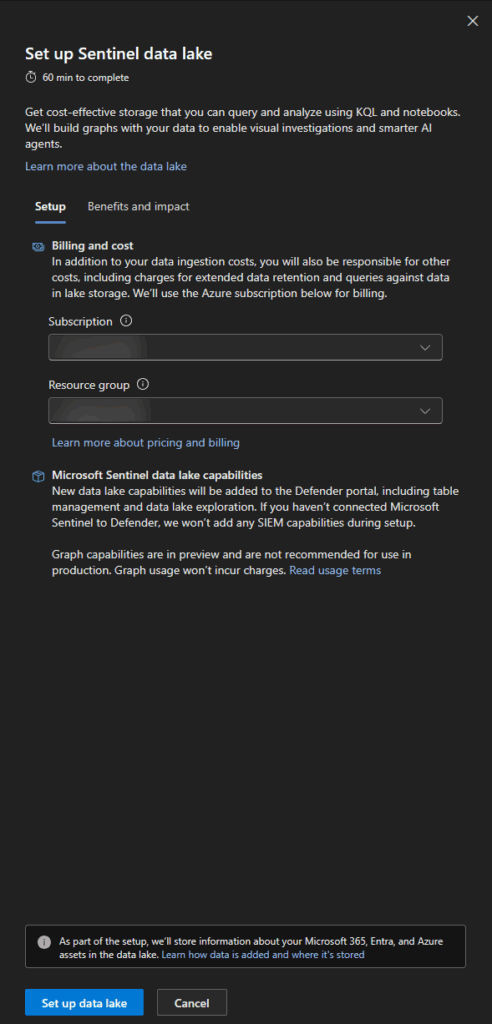
Click Set up data lake to begin provisioning process.
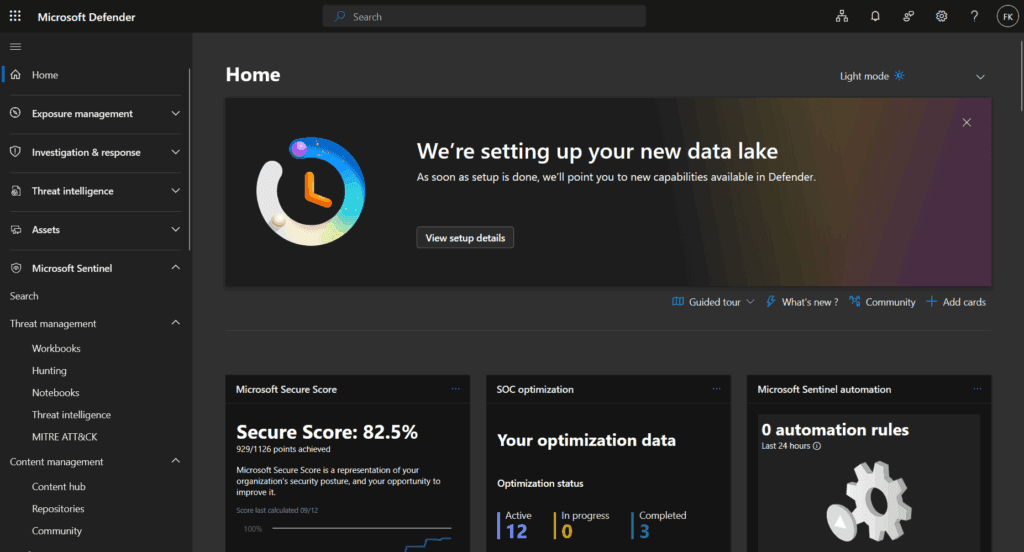
Step 4: Monitor setup progress
Setup timeline: Refer to the Critical Requirements Reference box above for detailed timeline expectations.
Step 5: Validate successful completion
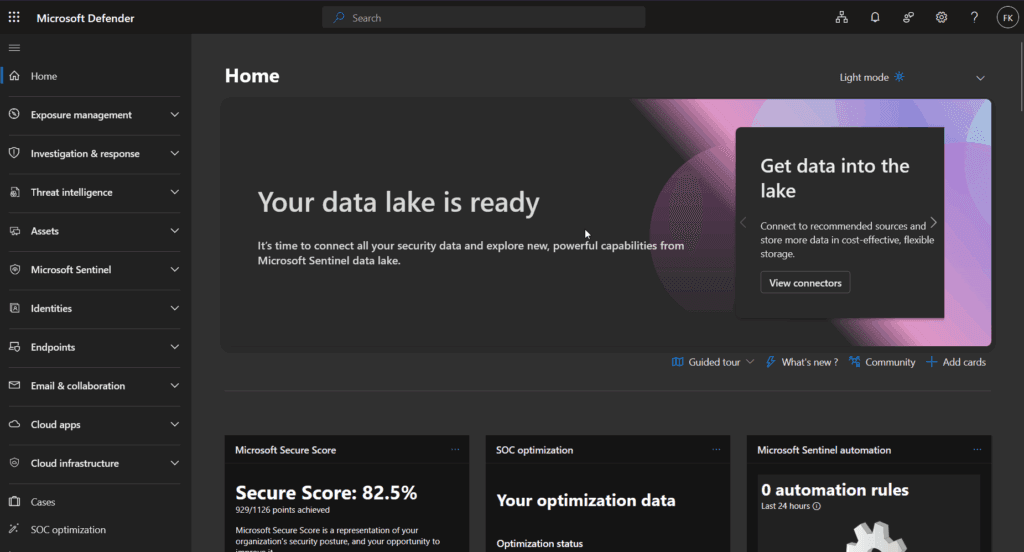
Success indicators:
- Completion banner Your data lake is ready with feature access cards
- New navigation option: Data lake exploration under Sentinel
- Enhanced Tables management capabilities
- Jobs section becomes available
Data Connectors
Microsoft Sentinel data lake works with all existing Sentinel data connectors, including:
- DNS, proxy, and email telemetry
- All Microsoft Defender XDR and Microsoft Sentinel data sources
- Microsoft 365
- Microsoft Entra ID
- Microsoft Resource Graph
- Endpoint Detection and Response (EDR) platforms
- Firewall and network logs
- Cloud infrastructure and workload telemetry
- Identity and access logs (Microsoft Entra, Okta, etc.)
Below the steps to activate for example the Defender XDR data connector (in case you haven’t got it enabled yet).
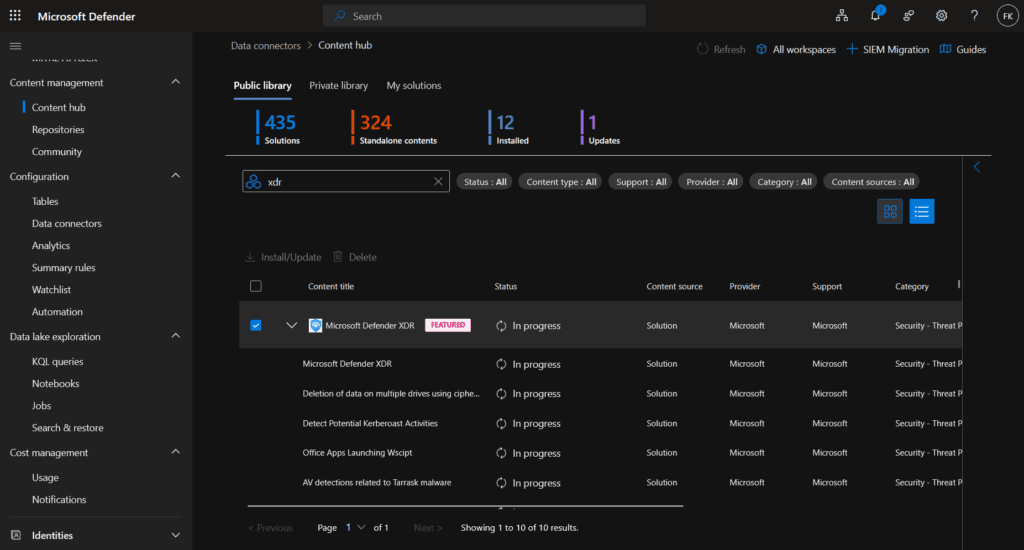
Access XDR data connector
- Navigate to Microsoft Defender Portal → Microsoft Sentinel → Configuration → Data connectors
- Search for “Microsoft Defender XDR” in the connector gallery
- Click Open connector page
Configure integration components The XDR connector configuration includes three main sections:
- Connect incidents and alerts: Enables basic integration for incident synchronization between platforms
- Connect entities: Integrates on-premises Active Directory user identities through Microsoft Defender for Identity
- Connect events: Enables collection of raw advanced hunting events from Defender components
Understanding XDR data streams
Free data streams (included with XDR integration):
- SecurityAlert: Alerts from all Defender products
- SecurityIncident: Unified incident management data
- Bi-directional synchronization: Incidents sync between Sentinel and Defender portals
Paid data streams (require analytics tier ingestion):
- DeviceProcessEvents: Process execution and command-line data
- DeviceNetworkEvents: Network connection and communication data
- DeviceFileEvents: File creation, modification, and access events
- DeviceLogonEvents: Authentication and session data
- EmailEvents: Email security and communication data
- CloudAppEvents: Cloud application activity and security events
- IdentityLogonEvents: Identity provider authentication events
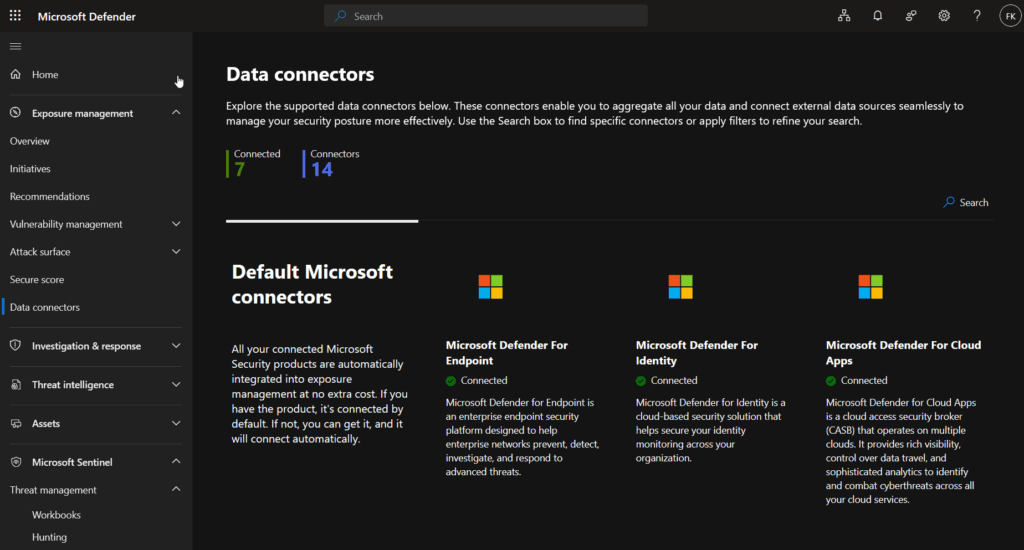
If you’ve Sentinel setup before and transitioned to the Unified Experience (Defender portal), existing connectors continue working without interruption. However, Microsoft Defender connectors (XDR, Endpoint, Identity, Office 365, Cloud Apps, and Defender for Cloud) won’t appear in the Data connectors tab under Sentinel—they’re automatically managed as part of the unified experience. To view these connectors, access Microsoft Sentinel through the Azure portal or from Exposure Management (only the status):
Retention configuration and management
Understanding data mirroring behavior
When you enable data lake, automatic mirroring begins for all tables from the onboarding point forward with these characteristics:
- Forward-looking only: Historical data existing before onboarding is not mirrored
- Automatic mirroring: All existing connectors automatically mirror data to data lake
- Consistent retention initially: Data lake tier matches analytics tier retention settings
- Single copy architecture: Same data serves both tiers without duplication
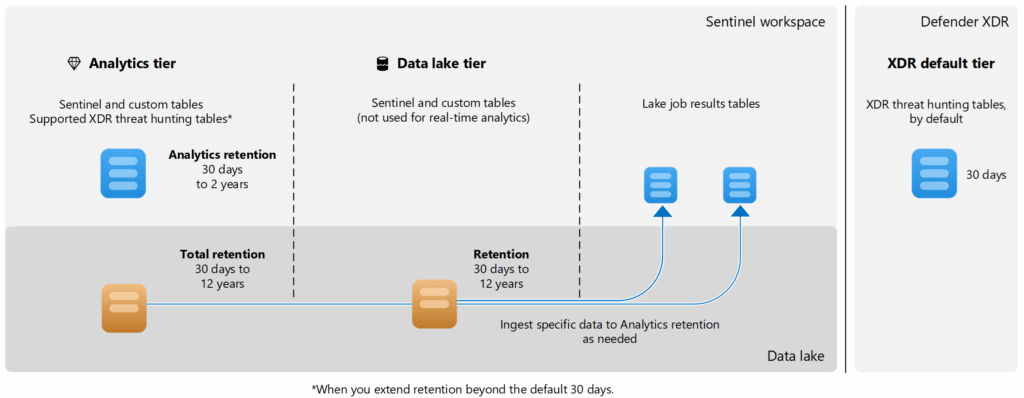
The Data lake retention model
As covered earlier, Data Lake uses a two-tier model:
| Tier | Default retention | Maximum retention | Purpose |
|---|---|---|---|
| Analytics tier (hot) | 30 days | 2 years | Real-time detection, hunting, analytics |
| Data lake tier (cold) | Mirrors analytics | 12 years | Long-term compliance, historical analysis |
Key cost insight: For Sentinel solution tables, 90 days of analytics tier storage is free (you only pay ingestion). For XDR tables, only 30 days is included in the XDR license. Data lake storage beyond analytics retention incurs additional costs.
Special case: XDR tables and data lake
XDR tables behave fundamentally differently than regular Sentinel solution tables, particularly around costs and retention:
Understanding XDR table tiers:
Before they’re ingested into your Sentinel workspace, XDR tables exist in what’s called the “XDR default tier” – essentially a 30-day buffer managed by the Defender XDR service. This data is:
- Included in your Defender XDR license (already paid for)
- Available via Advanced Hunting in Defender portal
- View-only and doesn’t participate in the data lake architecture
- Not ingested into Sentinel (so no Sentinel ingestion costs)
| Table type | Minimum analytics | Can use data lake? | Note |
|---|---|---|---|
| Sentinel/Custom | 30 days | ✅ Yes | Standard data lake behavior, 90 days free storage |
| XDR (not ingested) | N/A (30-day XDR default) | ❌ No | Must ingest first by setting retention > 30 days |
| XDR (ingested) | 30 days minimum | ✅ Yes | Now follows standard data lake model with costs |
Two methods for extending XDR table retention:
Method 1: Standard ingestion (covered in this section)
- Set analytics retention > 30 days in Defender portal
- XDR data ingests into Sentinel Analytics tier (expensive ingestion costs)
- Then automatically mirrors to data lake
Method 2: DCR transformation (cost-optimized)
- Bypass expensive Analytics tier ingestion entirely
- Route XDR data directly to data lake using custom tables
- Massive cost savings for compliance/archival scenarios
- Covered in next section: “Optimizing XDR costs with DCR transformations”
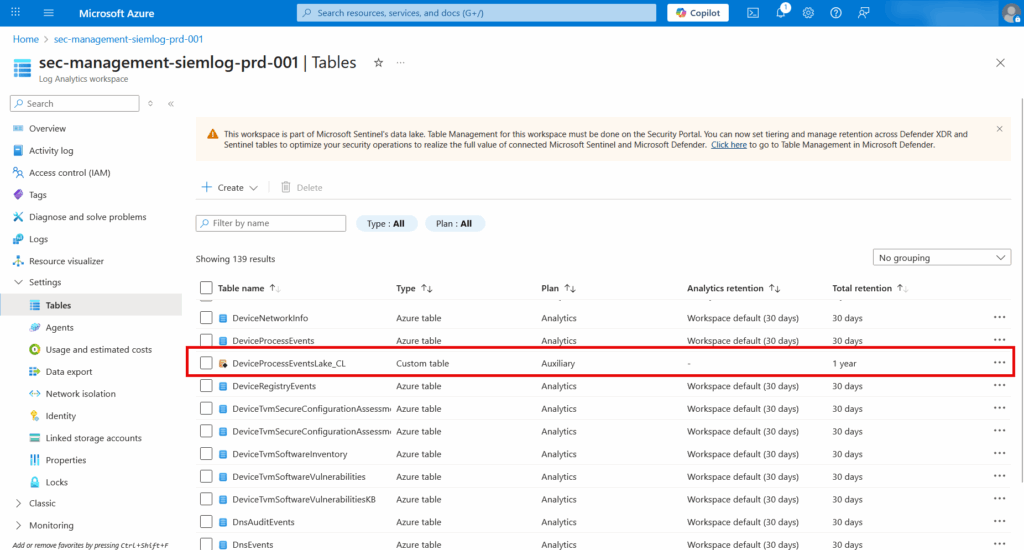
How to check current retention configuration
Step 1: Navigate to table management
Open Microsoft Defender Portal → Microsoft Sentinel → Configuration → Tables
You’ll see a list of all tables with their current retention settings
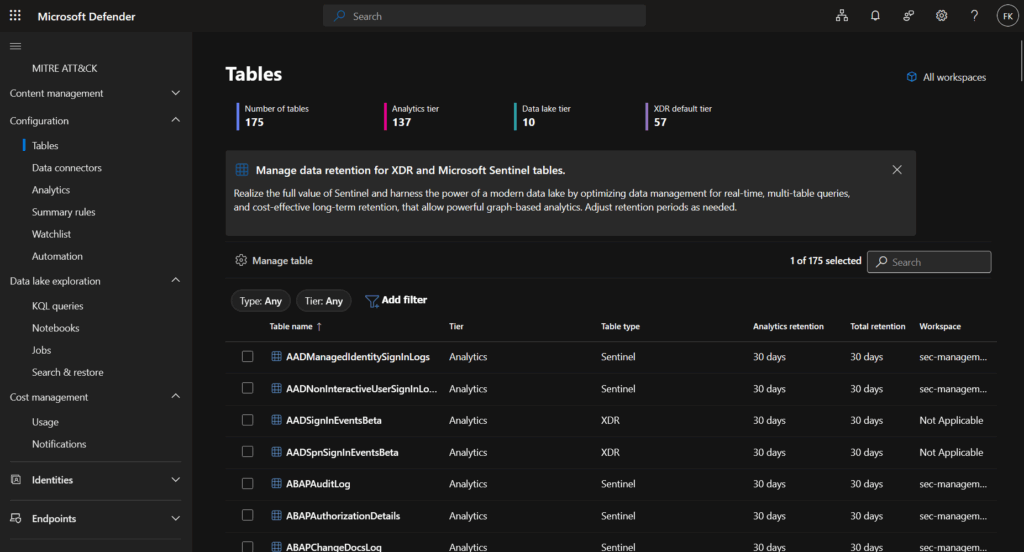
Step 2: Review retention overview
The table list displays key information:
| Column | Description |
|---|---|
| Table name | Name of the table |
| Workspace | Which Log Analytics workspace |
| Tier | Analytics, Data Lake, or XDR default |
| Analytics retention | Hot storage duration |
| Total retention | Analytics + data lake combined |
Step 3: Check detailed retention for a specific table
- Click on any table name
- A details panel opens on the right showing:
- Current tier (Analytics, data lake, or XDR default)
- Analytics retention period
- Total retention period
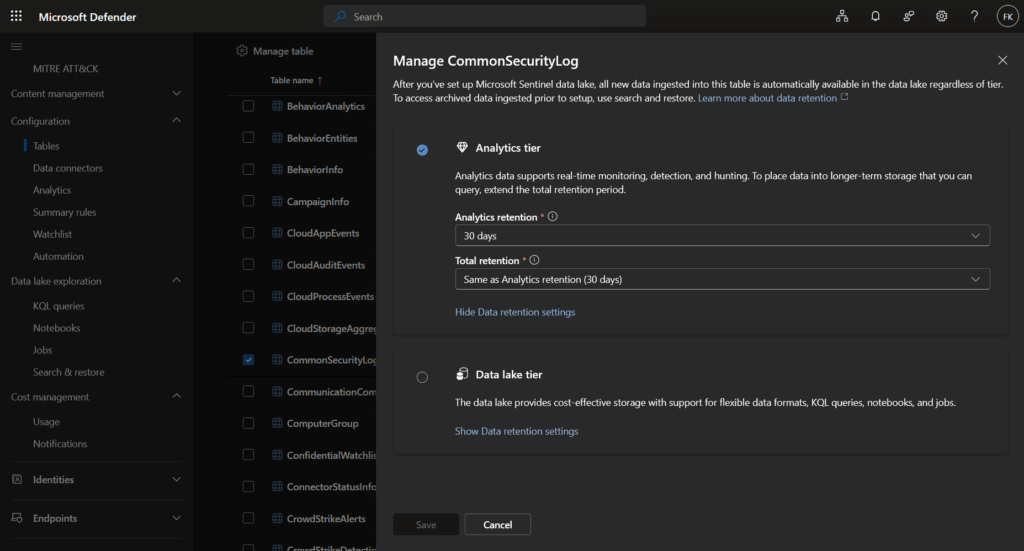
How to change retention configuration
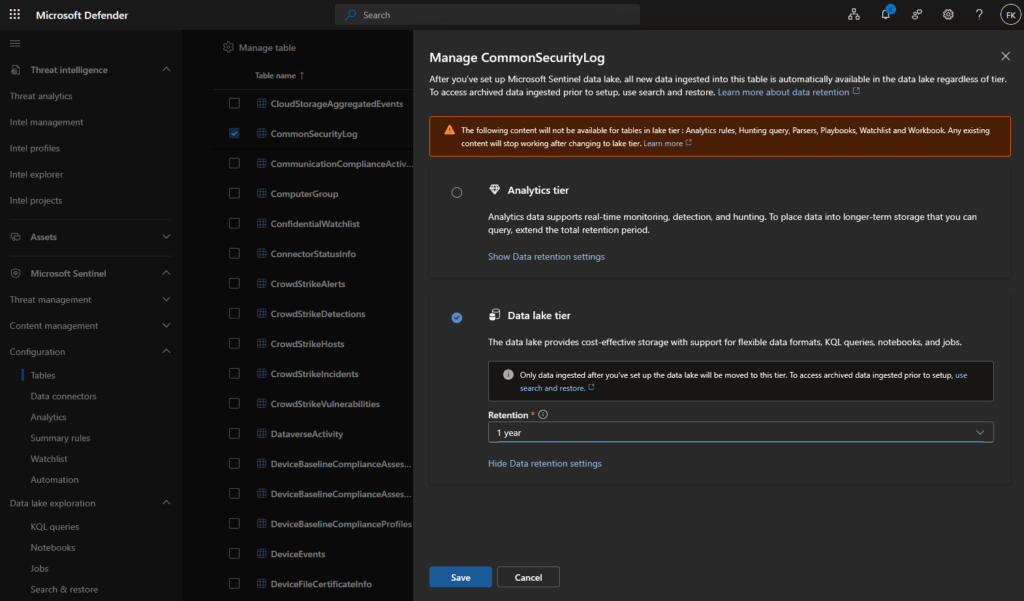
For Sentinel and custom tables:
Step 1: Navigate to Microsoft Defender Portal → Microsoft Sentinel → Configuration → Tables
Step 2: Click on your table → Click Manage table
Step 3: Configure retention:
- Analytics retention: 30 days to 2 years (hot storage)
- Total retention: Equal to or greater than analytics, max 12 years (hot + cold)
Step 4: Click Save
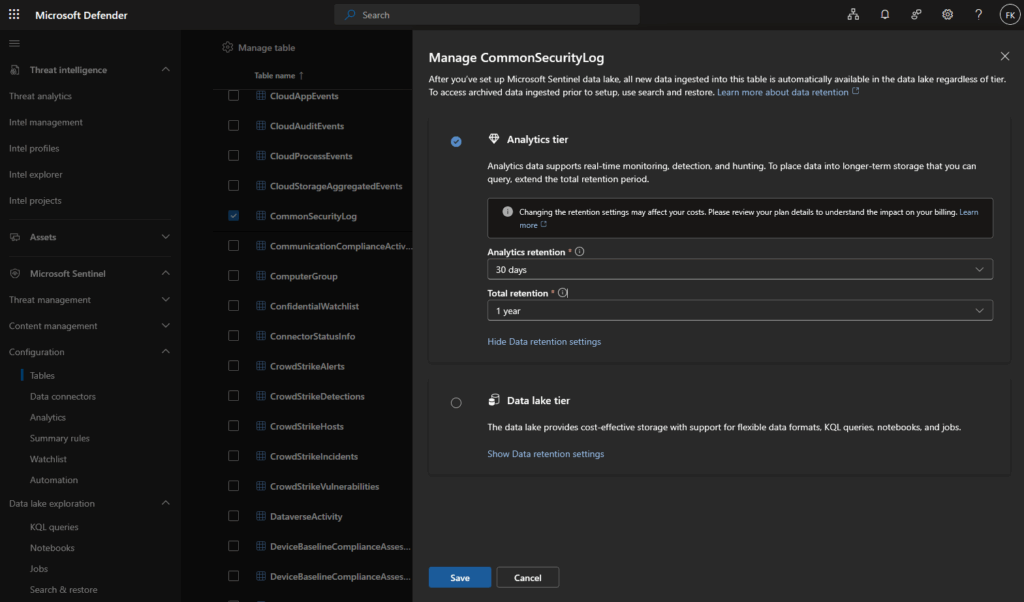
Example configuration:
Scenario: Need 1 year total retention for a Sentinel solution table
Configuration:
- Analytics retention: 90 days (free for Sentinel tables)
- Total retention: 1 year (365 days)
Result: 90 days in analytics + 275 days in data lake
Cost: Only data lake storage for days 91-365 (analytics storage is free)
Cost tip: You can also fully skip the analytics tier for some tables – this results in lower cost, but loses real-time analytics features like alerting, hunting queries, and analytics rules. Make sure you understand what functionality breaks before doing this:
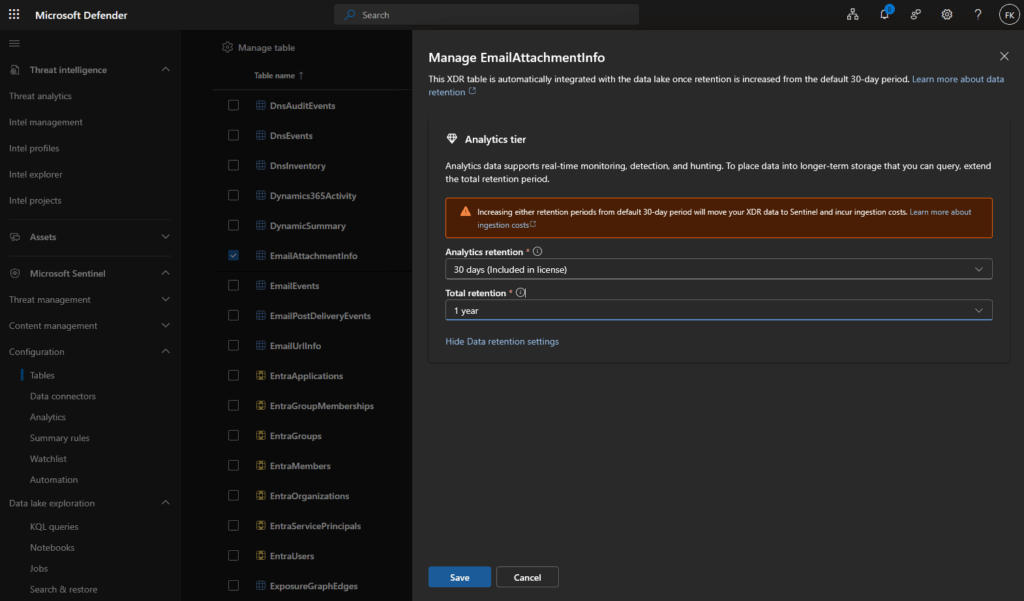
For XDR tables (enabling data lake – standard method):
IMPORTANT COST NOTICE: This method incurs significant Analytics tier ingestion costs. XDR tables only have 30 days included in your license (not 90 like Sentinel tables). Every day beyond 30 requires paying full Sentinel ingestion rates before data reaches the data lake. See the next section for a cost-optimized alternative via DCR.
Step 1: Navigate to Tables → Locate XDR table showing “XDR default tier”
Examples: DeviceEvents, EmailEvents, IdentityInfo, AlertEvidence, DeviceProcessEvents
Step 2: Click on the XDR table → Click Manage table
Step 3: Set analytics retention > 30 days
This triggers ingestion into Sentinel and incurs expensive ingestion costs
Common values: 60, 90, 180, 365 days (preferable 90 days if using standard method)
Step 4: Set total retention (equal to or greater than analytics)
Example: 365 days for 1-year compliance
Step 5: Review cost warnings → Click Save
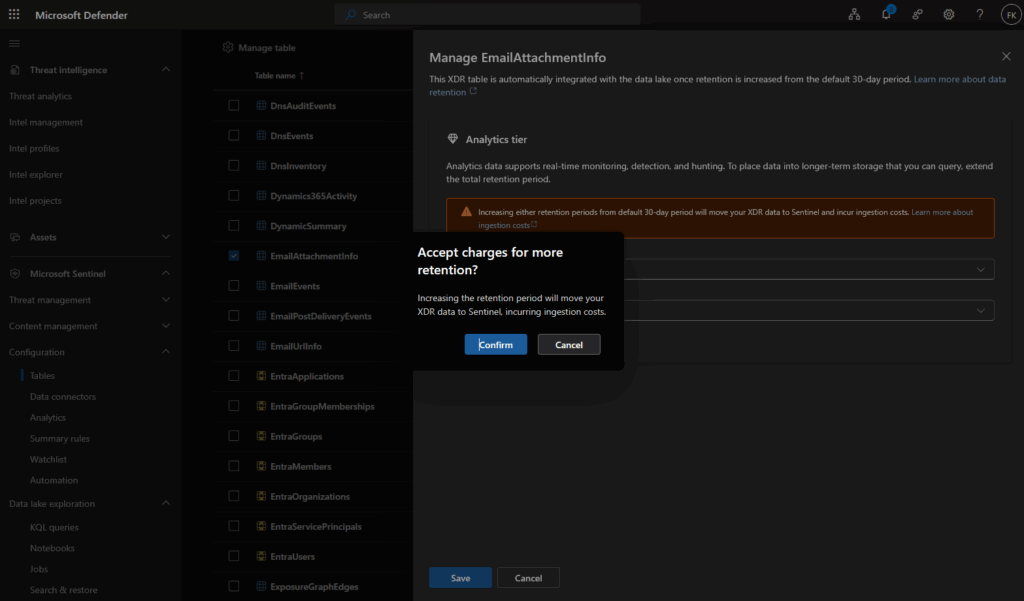
What happens:
- Ingestion begins immediately (costs start here)
- Data flows: XDR → Sentinel Analytics tier (expensive) → Data lake mirror
- Table type changes from “XDR default” to “Microsoft Sentinel”
- You’re now paying for both Analytics ingestion + any data lake storage beyond analytics retention
To stop ingestion: Set both Analytics and Total retention back to 30 days
Cost breakdown example for XDR tables:
| Scenario | Analytics | Total | Cost structure |
|---|---|---|---|
| Stay in XDR default | 30 days | 30 days | $0 – Included in license |
| Standard method | 90 days | 90 days | Analytics ingestion for 90 days (expensive) |
| Standard + compliance | 90 days | 1 year | Analytics ingestion for 90 days + Data lake storage (days 91-365) |
Next section: Learn how to bypass these expensive ingestion costs using DCR transformations to send XDR data directly to data lake tier (especially handy for noisy tables).
Recommended retention configurations
| Scenario | Analytics | Total | Use case |
|---|---|---|---|
| Standard operations | 90 days | 90 days | Active security operations, no extended compliance |
| Balanced approach | 90 days | 365 days | Operations with 1-year compliance |
| Extended compliance | 90 days | 2-7 years | Regulatory requirements (GDPR, HIPAA) |
| Cost-optimized | 30 days | 365 days – 7 years | Minimal hot storage, extended cold storage |
Optimizing XDR costs with DCR transformations
The cost problem
As we explored in the previous section, extending XDR table retention beyond 30 days using the standard method triggers expensive Analytics tier ingestion. The warning dialog makes this clear: increasing retention moves your XDR data to Sentinel and incurs ingestion costs.
The impact: 1TB/day of XDR data = ~$96,000/month in ingestion costs alone. For many organizations, this makes long-term retention financially prohibitive, even when required for compliance.
Understanding the optimization approach
The key insight is that XDR data already exists for free in your environment – it’s included in your Defender XDR license and available via Advanced Hunting for 30 days. The problem is the expensive journey it takes when you need to keep it longer.
Standard flow (expensive):
XDR Advanced Hunting (30d free) → Analytics Tier Ingestion ($$$) → Data Lake Mirror
Optimized flow (cost-effective):
XDR Advanced Hunting (30d free) → Workspace DCR Transformation → Custom Data Lake Tables ($)
By using Data Collection Rules (DCR) with workspace transformations, we can route XDR data directly to custom tables in the data lake tier, completely bypassing expensive Analytics tier ingestion. This is a legitimate Microsoft-supported feature that’s just not widely documented for this use case, but got inspired by Jeffrey Appel his approach for this.
Key benefits and trade-offs
Benefits:
- Eliminate Analytics tier ingestion costs entirely
- Keep 30 days free in XDR Advanced Hunting for real-time detection
- Store years of data in low-cost data lake tier
- Perfect for compliance and historical analysis
- Single DCR handles multiple tables
Trade-offs:
- No real-time alerting or analytics rules on custom tables
- Slower queries compared to Analytics tier
- Requires initial setup and ongoing management
- Custom tables have limited feature support
Critical decision: Only use this method for XDR data needed for compliance/historical purposes. If you need real-time detection beyond 30 days, keep those tables in Analytics tier. Many organizations use a hybrid approach.
Choosing which tables to optimize
Not all XDR tables are equal candidates. Base your decision on volume, analytical needs, and compliance requirements.
| XDR Table | Volume | Recommendation | Reasoning |
|---|---|---|---|
| DeviceProcessEvents | Very High | Optimize | Highest volume, mostly needed for forensics |
| DeviceNetworkEvents | Very High | Optimize | High noise-to-signal ratio |
| DeviceFileEvents | High | Optimize | Primarily used for investigations |
| CloudAppEvents | Medium | Consider | Depends on detection requirements |
| EmailEvents | Medium | Consider | May need for phishing detection |
| AlertEvidence | Low | Keep in Analytics | Critical for investigations |
| IdentityInfo | Very Low | Keep in Analytics | Required for UEBA |
Optimize when:
- High-volume, low-value data (verbose logs)
- Compliance retention only
- Historical analysis and forensics needs
Keep in Analytics when:
- Real-time alerting required
- UEBA or behavioral analytics needed
- Active detection rules depend on the data
Prerequisites and tools
Before implementing this optimization, you’ll need a few things in place.
1. Marko Lauren’s Table Creator Tool
The tool is essential because Azure Data Lake tables (Auxiliary tier) don’t natively support dynamic data types, which many XDR tables use. Marko’s tool solves this by automating the table creation process and handling the schema complexity.
GitHub link
What it does:
- Reads source table schema from your workspace
- Creates matching custom table with correct structure
- Handles dynamic fields via Analytics tier workaround
- Enables seamless switching to Data Lake tier
The workaround: Create tables in Analytics tier first (which supports dynamic types), then switch to Data Lake tier via the portal. This preserves the dynamic field support.
2. Azure access requirements
- Contributor or Owner permissions on Log Analytics workspace
- Ability to deploy ARM templates
- Access to Azure Portal and Defender portal
3. Optimization scope decision
Identify which XDR tables to optimize based on current ingestion volumes, real-time analytics requirements, compliance needs, and detection rule dependencies. Start with your highest-volume tables for maximum impact.
Implementation guide
The implementation follows three main steps: creating custom tables, configuring the DCR, and verifying data flow. Let’s walk through each one.
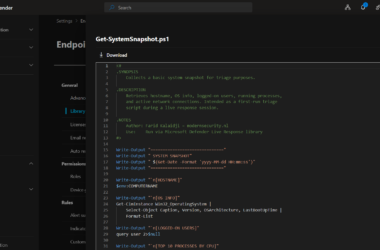
Step 1: Create custom data lake tables
We’ll use Marko Lauren’s tableCreator.ps1 script to automate the table creation process and avoid schema issues.
Download the tool
Download tableCreator.ps1 from the GitHub repository:
GitHub link
Run the table creator
The tool uses command-line parameters. Execute it via Azure CLI with your workspace details:
# Login to Azure
az login

# Run the table creator script with parameters
.\tableCreator.ps1 -tableName DeviceProcessEvents -newTableName DeviceProcessEventsLake_CL -type analytics -retention 30 -totalRetention 365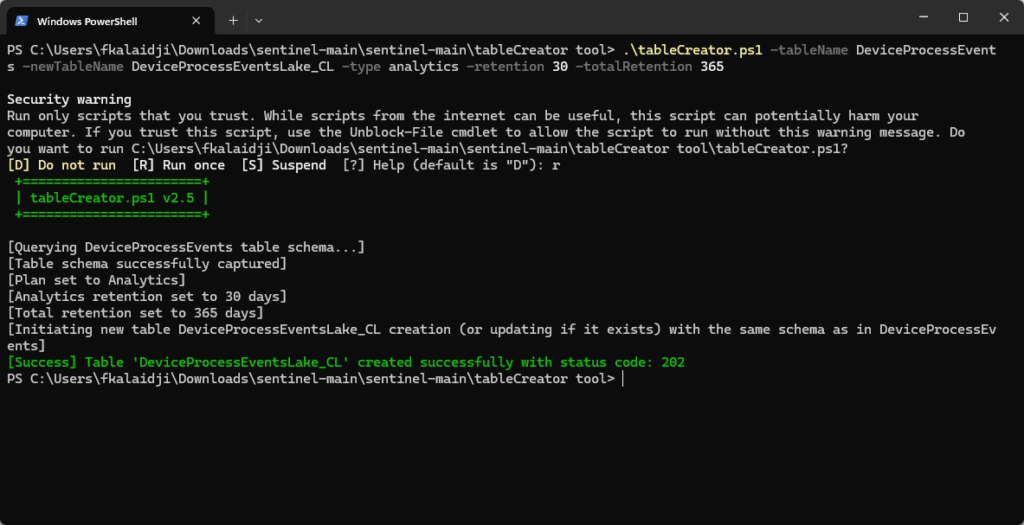
Parameter explanation:
| Parameter | Value | Description |
|---|---|---|
-tableName | DeviceProcessEvents | Existing XDR table to replicate |
-newTableName | DeviceProcessEventsLake_CL | New custom table name (must end with _CL) |
-type | analytics | Start with analytics, not datalake/auxiliary |
-retention | 365 | Total retention in days |
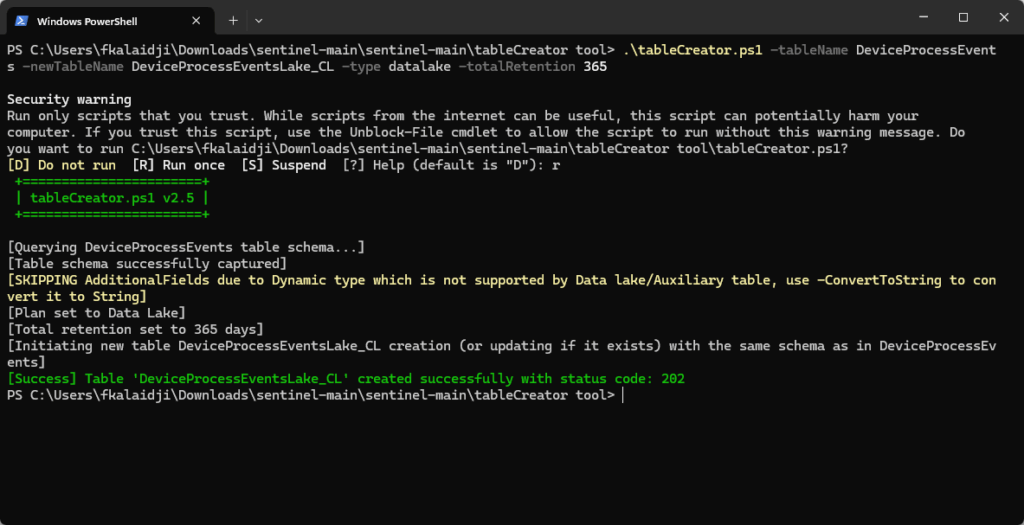
-ConvertToString | (optional) | Use if you get dynamic type errors |
-TenantId | (optional) | Specify if multi-tenant environment |
Why -type analytics first? Even though our final destination is Data Lake, we must create the table as analytics type initially to preserve dynamic field support. We’ll switch it to Data Lake tier in the next step.
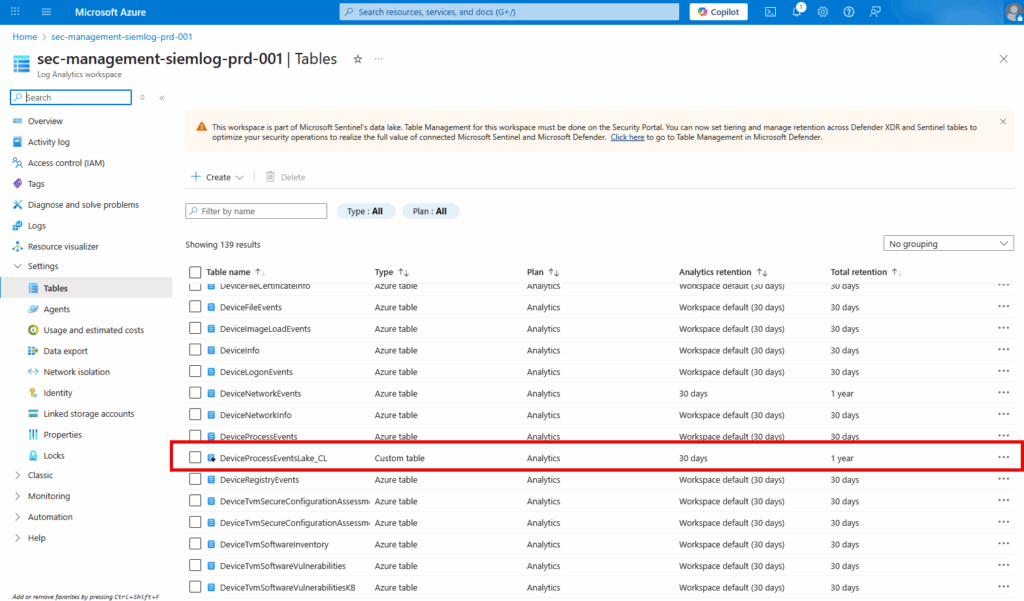
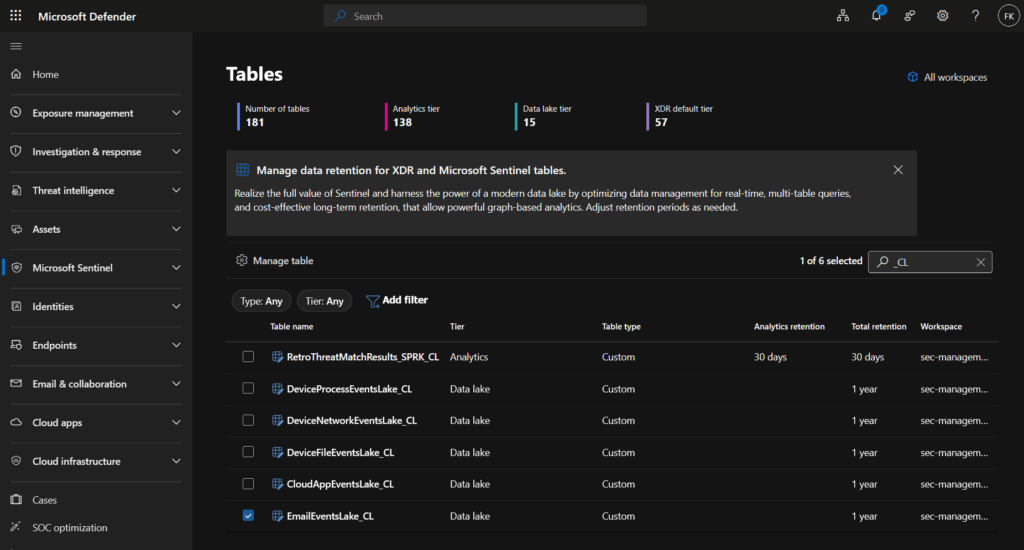
Switch table to data lake tier
Now that the table exists with the correct schema including dynamic fields, switch it to data Lake tier:
Navigate to Microsoft Defender Portal → Microsoft Sentinel → Configuration → Tables
- Locate your custom table (
DeviceProcessEventsLake_CL) - Click on the table → Click Manage table
- Under table tier options, select data lake tier only
- Configure retention (e.g., 1 year for compliance)
- Click Save
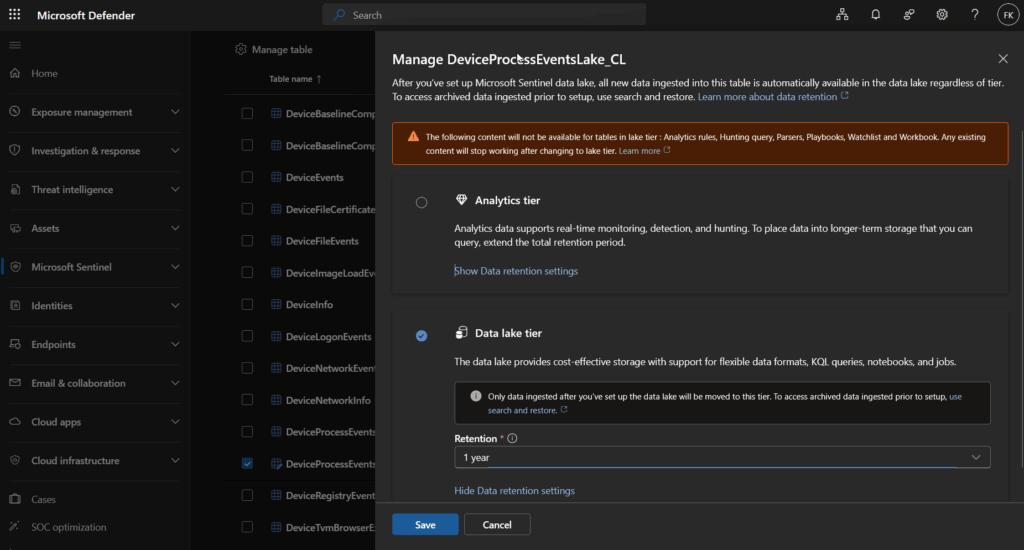
Your table is now in the Auxiliary (data lake) tier with full dynamic field support, ready to receive data.
Create additional tables
Repeat this process for each XDR table you want to optimize:
| Source Table | Custom Table Name | Use Case |
|---|---|---|
| DeviceProcessEvents | DeviceProcessEventsLake_CL | Process execution history |
| DeviceNetworkEvents | DeviceNetworkEventsLake_CL | Network connection logs |
| DeviceFileEvents | DeviceFileEventsLake_CL | File activity forensics |
| CloudAppEvents | CloudAppEventsLake_CL | Cloud application activity |
| EmailEvents | EmailEventsLake_CL | Email flow history |
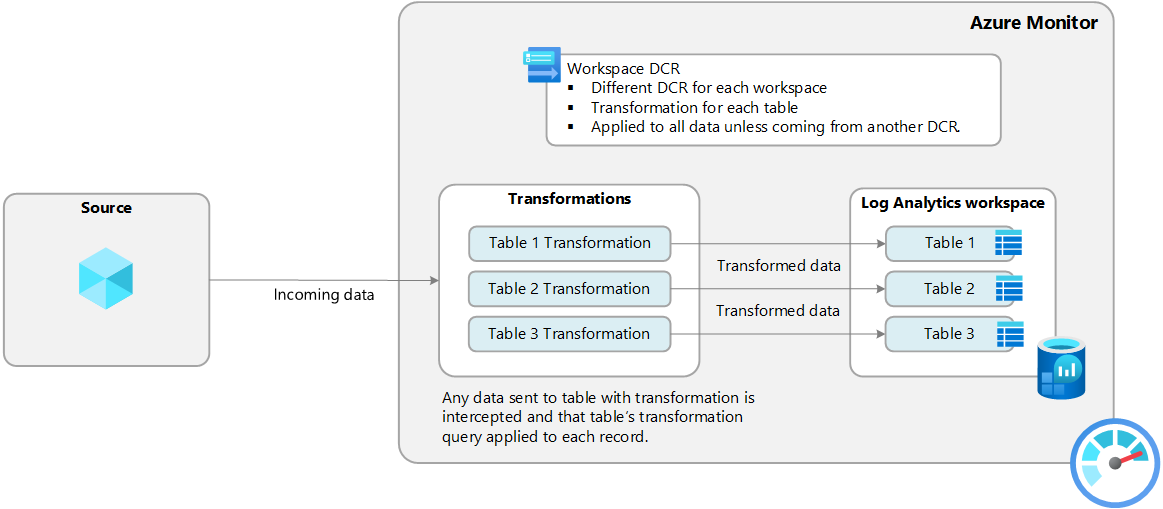
Step 2: Create workspace transformation DCR
Now we’ll create the Data Collection Rule that routes XDR data from original tables to your custom Data Lake tables. This is where the magic happens.
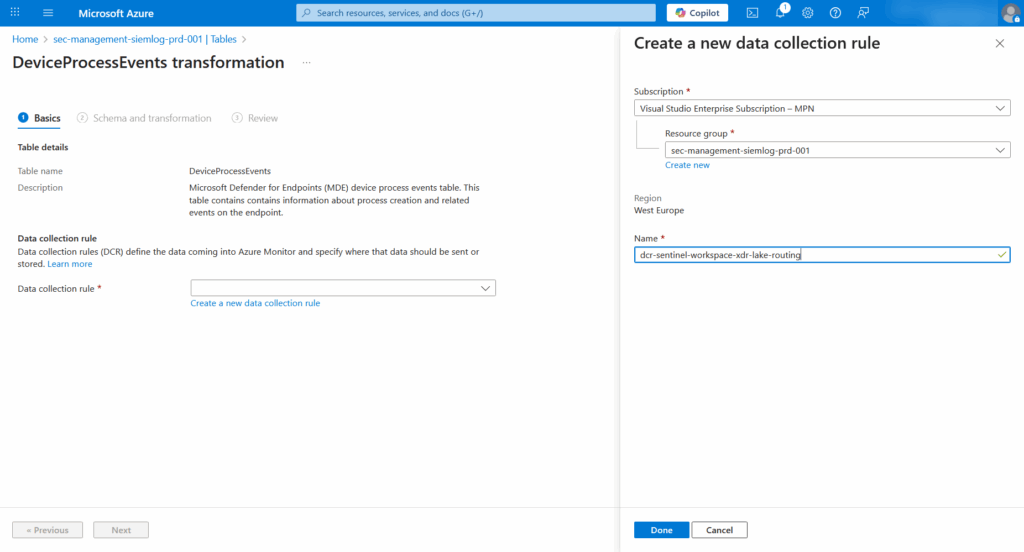
Initial DCR creation via portal
Start by creating the basic DCR structure through the Azure Portal:
Navigate to Azure Portal → Log Analytics workspaces → Select your workspace → Tables
- Locate any source XDR table (e.g.,
DeviceProcessEvents) - Click on the table → Click Create transformation
- Configure the DCR:
| Field | Value | Note |
|---|---|---|
| DCR name | dcr-sentinel-workspace-xdr-lake-routing | Use descriptive name |
| Resource group | Same as workspace | Keep together |
| Region | Same as workspace | Performance |
| Description | Routes XDR data to Data Lake custom tables | Clear purpose |
- Click Create
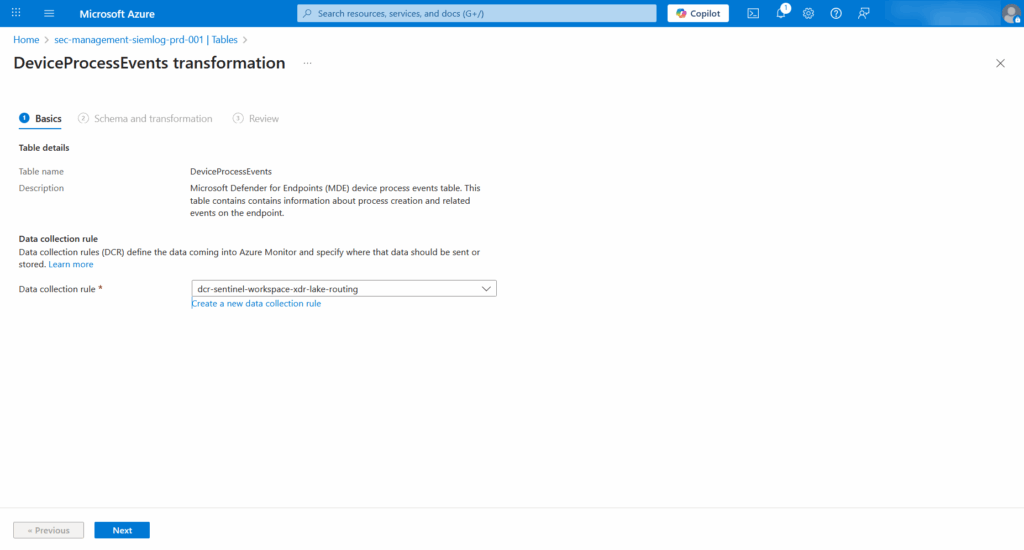
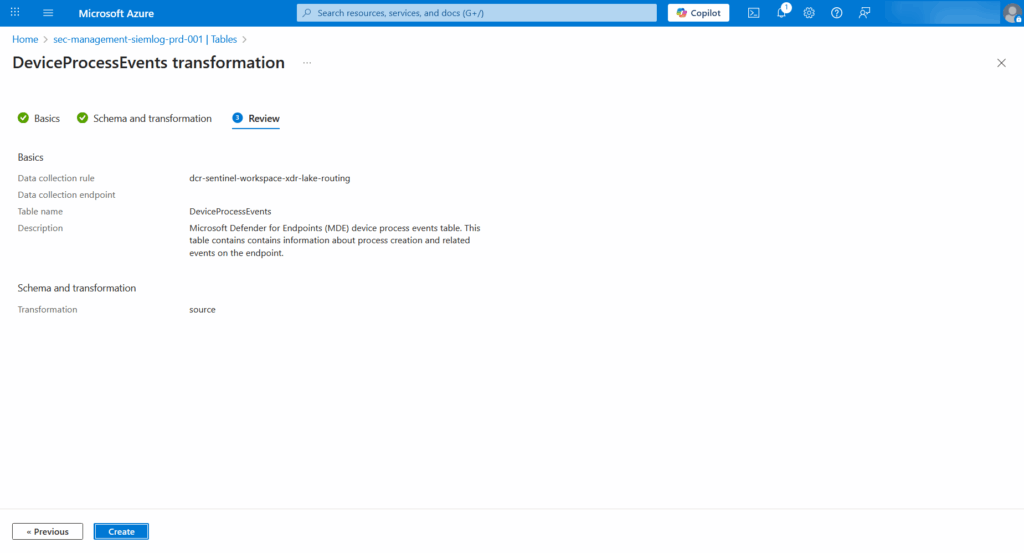
This creates a Workspace Transformation DCR (Kind: WorkspaceTransforms) that’s automatically associated with your workspace.
Important limitation: You can only have one Workspace Transformation DCR per workspace, but this single DCR can handle all your table routing.
Configure DCR via ARM template
The portal UI only allows configuring one table at a time. To efficiently route multiple XDR tables, we’ll edit the DCR’s ARM template directly.
Navigate to Azure Portal → Data Collection Rules → Locate your DCR
- Verify Kind shows
WorkspaceTransformsin the Overview - Click Export template → Deploy → Edit template
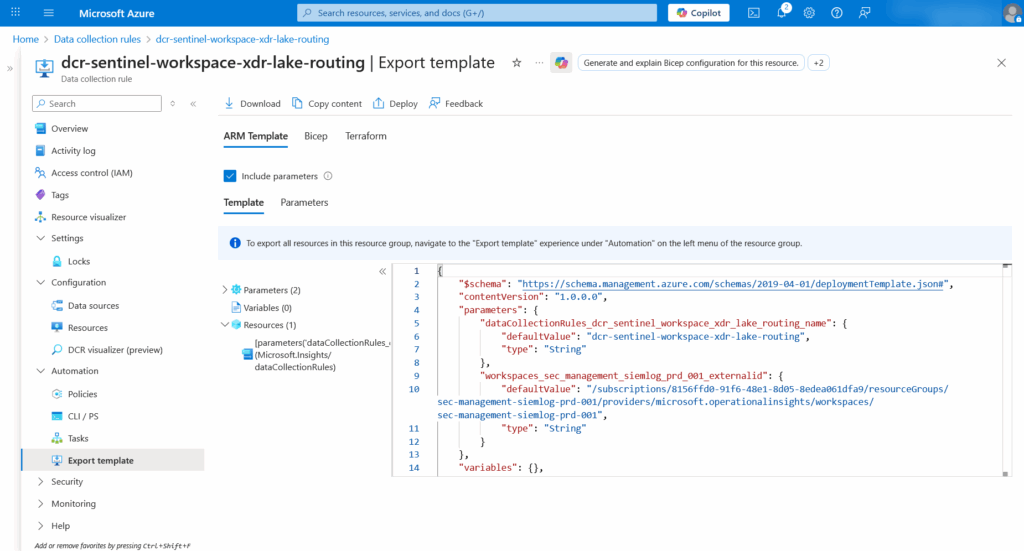
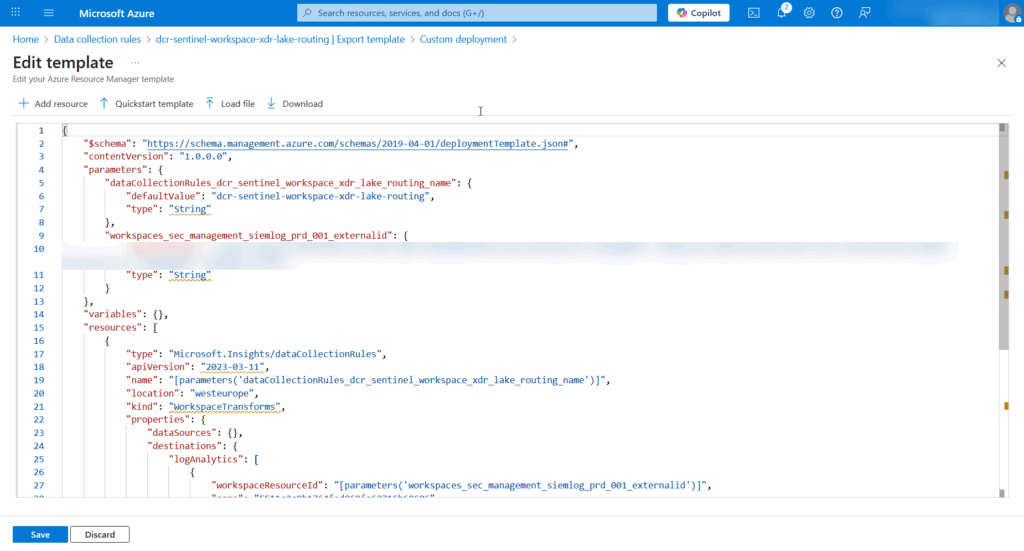
- Write down the name from the workspaceresourceId (under LogAnalytics):
        {
            "type": "Microsoft.Insights/dataCollectionRules",
            "apiVersion": "2023-03-11",
            "name": "[parameters('dataCollectionRules_dcr_sentinel_workspace_xdr_lake_routing_name')]",
            "location": "westeurope",
            "kind": "WorkspaceTransforms",
            "properties": {
                "dataSources": {},
                "destinations": {
                    "logAnalytics": [
                        {
                            "workspaceResourceId": "[parameters('workspaces_sec_management_siemlog_prd_001_externalid')]",
                            "name": "5511c2c9b1764fed860fa62716b60686"
                        }
                    ]
                },
- Replace the template content (dataFlows-part) with the configuration below. The template configures data flows for multiple XDR tables simultaneously:
"dataFlows": [
  {
    "streams": [
      "Microsoft-Table-DeviceProcessEvents"
    ],
    "destinations": [
      "5511c2c9b1764fed860fa62716b60686"
    ],
    "outputStream": "Custom-DeviceProcessEventsLake_CL"
  },
  {
    "streams": [
      "Microsoft-Table-DeviceNetworkEvents"
    ],
    "destinations": [
      "5511c2c9b1764fed860fa62716b60686"
    ],
    "outputStream": "Custom-DeviceNetworkEventsLake_CL"
  },
  {
    "streams": [
      "Microsoft-Table-DeviceFileEvents"
    ],
    "destinations": [
      "5511c2c9b1764fed860fa62716b60686"
    ],
    "outputStream": "Custom-DeviceFileEventsLake_CL"
  },
  {
    "streams": [
      "Microsoft-Table-CloudAppEvents"
    ],
    "destinations": [
      "5511c2c9b1764fed860fa62716b60686"
    ],
    "outputStream": "Custom-CloudAppEventsLake_CL"
  },
  {
    "streams": [
      "Microsoft-Table-EmailEvents"
    ],
    "destinations": [
      "5511c2c9b1764fed860fa62716b60686"
    ],
    "outputStream": "Custom-EmailEventsLake_CL"
  }
]
You will end up with a template like this:
{
    "$schema": "https://schema.management.azure.com/schemas/2019-04-01/deploymentTemplate.json#",
    "contentVersion": "1.0.0.0",
    "parameters": {
        "dataCollectionRules_dcr_sentinel_workspace_xdr_lake_routing_name": {
            "defaultValue": "dcr-sentinel-workspace-xdr-lake-routing",
            "type": "String"
        },
        "workspaces_sec_management_siemlog_prd_001_externalid": {
            "defaultValue": "/subscriptions/xxxxxxxxxxxxxxxxxxxxxxxxxxxxxxxxxxxxxx/resourceGroups/sec-management-siemlog-prd-001/providers/microsoft.operationalinsights/workspaces/sec-management-siemlog-prd-001",
            "type": "String"
        }
    },
    "variables": {},
    "resources": [
        {
            "type": "Microsoft.Insights/dataCollectionRules",
            "apiVersion": "2023-03-11",
            "name": "[parameters('dataCollectionRules_dcr_sentinel_workspace_xdr_lake_routing_name')]",
            "location": "westeurope",
            "kind": "WorkspaceTransforms",
            "properties": {
                "description": "Routes XDR tables directly to Data Lake custom tables, bypassing Analytics tier ingestion costs",
                "dataSources": {},
                "destinations": {
                    "logAnalytics": [
                        {
                            "workspaceResourceId": "[parameters('workspaces_sec_management_siemlog_prd_001_externalid')]",
                            "name": "5511c2c9b1764fed860fa62716b60686"
                        }
                    ]
                },
                "dataFlows": [
                    {
                        "streams": [
                            "Microsoft-Table-DeviceProcessEvents"
                        ],
                        "destinations": [
                            "5511c2c9b1764fed860fa62716b60686"
                        ],
                        "outputStream": "Custom-DeviceProcessEventsLake_CL"
                    },
                    {
                        "streams": [
                            "Microsoft-Table-DeviceNetworkEvents"
                        ],
                        "destinations": [
                            "5511c2c9b1764fed860fa62716b60686"
                        ],
                        "outputStream": "Custom-DeviceNetworkEventsLake_CL"
                    },
                    {
                        "streams": [
                            "Microsoft-Table-DeviceFileEvents"
                        ],
                        "destinations": [
                            "5511c2c9b1764fed860fa62716b60686"
                        ],
                        "outputStream": "Custom-DeviceFileEventsLake_CL"
                    },
                    {
                        "streams": [
                            "Microsoft-Table-CloudAppEvents"
                        ],
                        "destinations": [
                            "5511c2c9b1764fed860fa62716b60686"
                        ],
                        "outputStream": "Custom-CloudAppEventsLake_CL"
                    },
                    {
                        "streams": [
                            "Microsoft-Table-EmailEvents"
                        ],
                        "destinations": [
                            "5511c2c9b1764fed860fa62716b60686"
                        ],
                        "outputStream": "Custom-EmailEventsLake_CL"
                    }
                ]
            }
        }
    ]
}
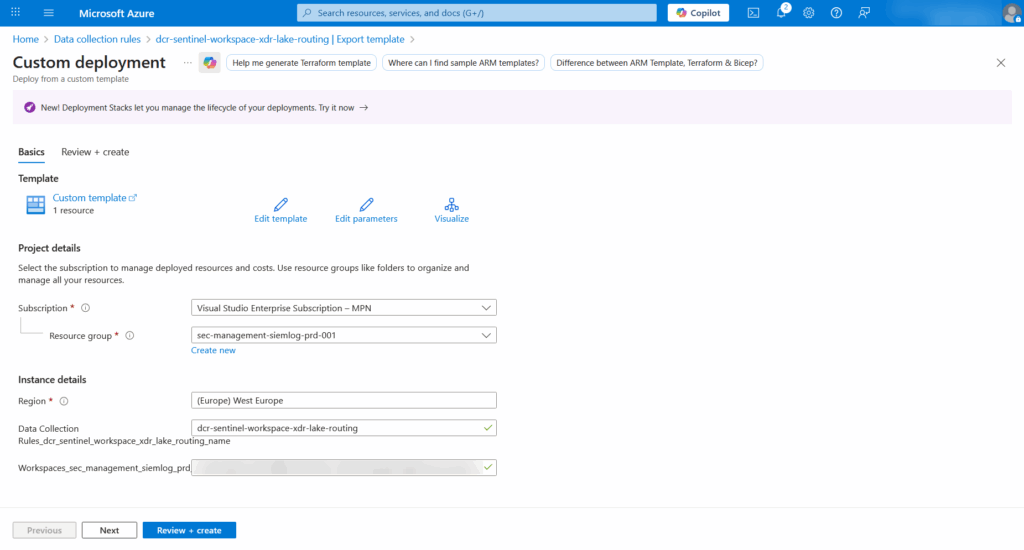
Understanding the template:
Each dataFlow entry routes data from a source stream to a destination table. The streams value must match Microsoft’s exact naming (e.g., Microsoft-Table-DeviceProcessEvents). The outputStream must include the Custom- prefix for custom tables. The transformKql value of "source" means no filtering – all data passes through. You can add KQL filtering here if needed (covered later).
Click Save → Review + create → Create to deploy the DCR
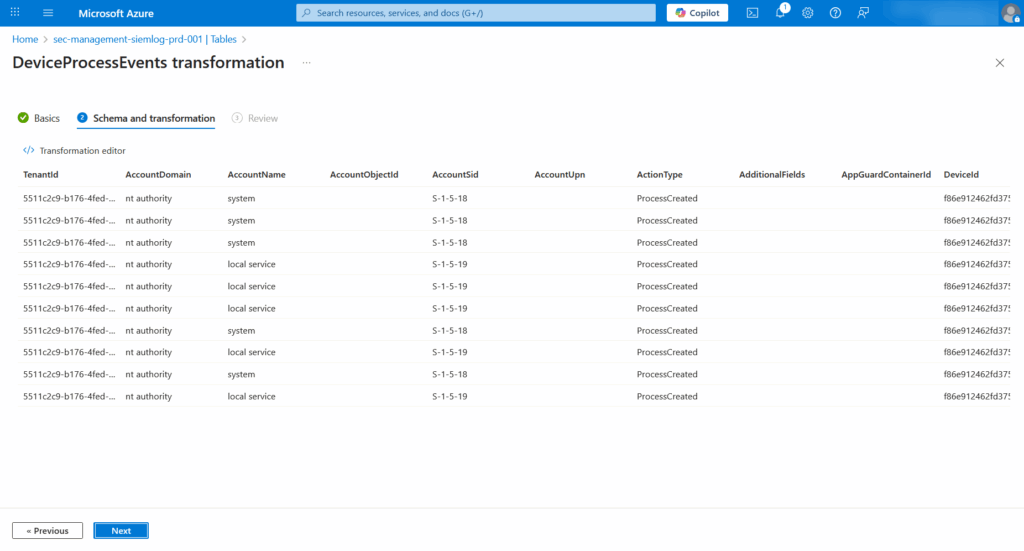
Step 3: Verify data flow
After deploying the DCR, data should start flowing to your custom tables within 15-30 minutes. Let’s verify everything is working correctly.
Check 1: Original table status
DeviceProcessEvents
| take 10
Expected: Low count or zero (data is being routed to the custom table)
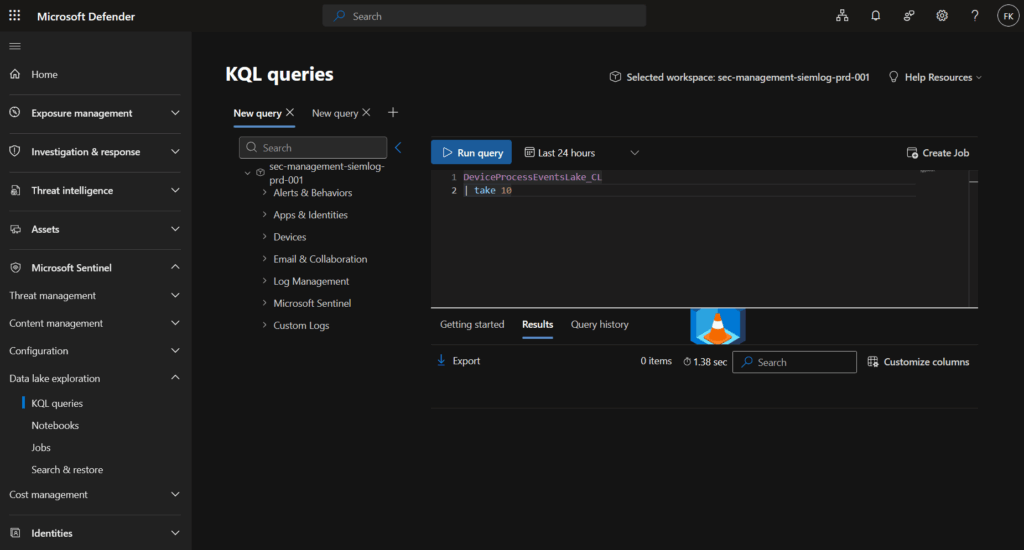
Check 2: Custom table receiving data
DeviceProcessEventsLake_CL
| take 10
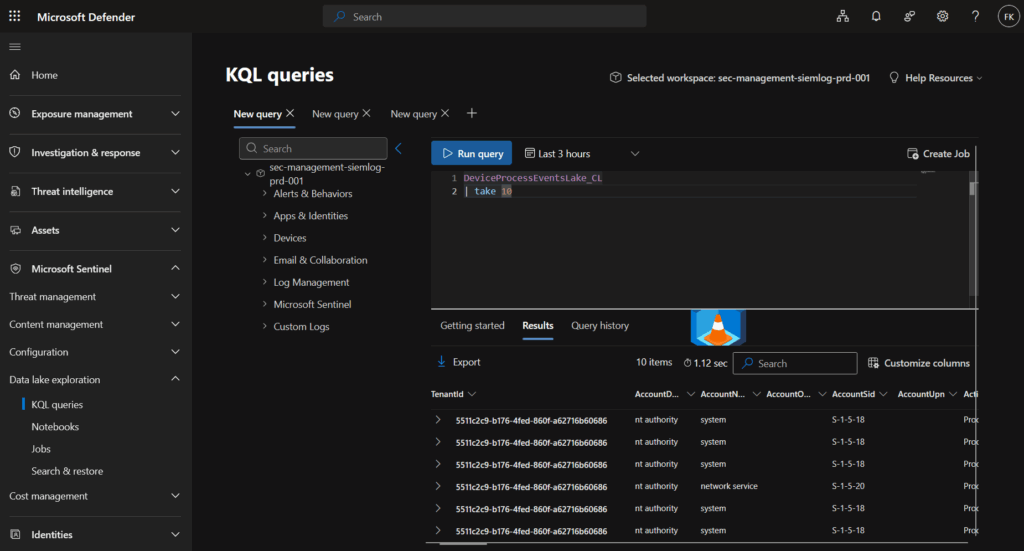
Expected: Data flowing with proper schema
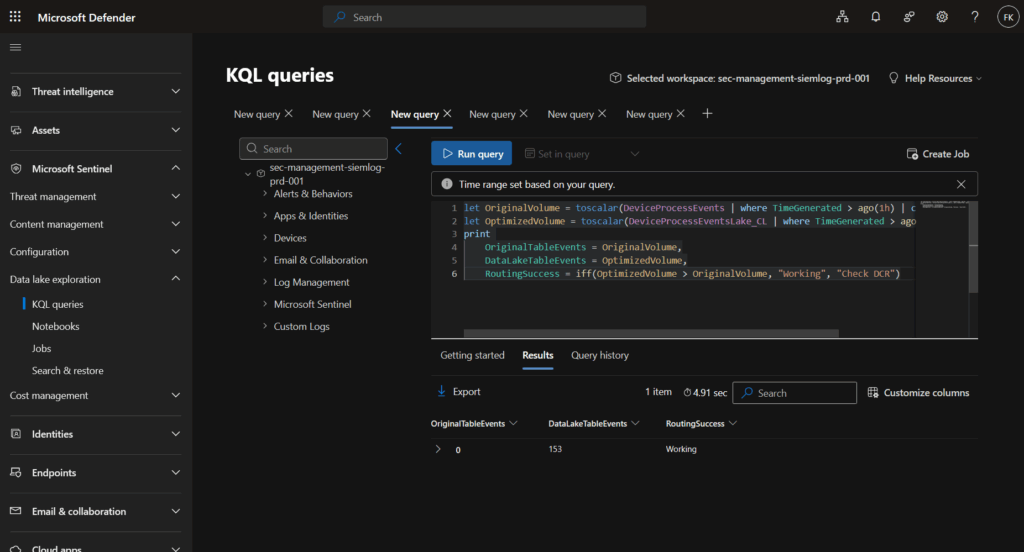
Monitor cost savings
Track the effectiveness of your optimization with these queries:
Volume comparison:
let OriginalVolume = toscalar(DeviceProcessEvents | where TimeGenerated > ago(24h) | count);
let OptimizedVolume = toscalar(DeviceProcessEventsLake_CL | where TimeGenerated > ago(24h) | count);
print
    OriginalTableEvents = OriginalVolume,
    DataLakeTableEvents = OptimizedVolume,
    RoutingSuccess = iff(OptimizedVolume > OriginalVolume, "Working", "Check DCR")
Cost savings estimate KQL example:
let DailyVolumeGB = toscalar(
    DeviceProcessEventsLake_CL
    | where TimeGenerated > ago(24h)
    | extend DataSizeBytes = estimate_data_size(*)
    | summarize TotalBytes = sum(DataSizeBytes)
    | extend GB = TotalBytes / 1024 / 1024 / 1024
    | project GB
);
// Updated costs for 2025 GA pricing (East US region)
let AnalyticsIngestionCost = 4.30;  // Per GB (updated from $3.207)
let DataLakeIngestionCost = 0.05;    // Per GB
let DataLakeProcessingCost = 0.10;   // Per GB
let DataLakeStorageCost = 0.02;      // Per GB per month (compressed)
// Calculate monthly costs
let StandardMethodCost = DailyVolumeGB * 30 * AnalyticsIngestionCost;
let OptimizedMethodCost = (DailyVolumeGB * 30 * (DataLakeIngestionCost + DataLakeProcessingCost)) + (DailyVolumeGB * 30 * DataLakeStorageCost);
let MonthlySavings = StandardMethodCost - OptimizedMethodCost;
print
    DailyVolumeGB = round(DailyVolumeGB, 2),
    MonthlyVolumeTB = round((DailyVolumeGB * 30) / 1024, 2),
    StandardMethodCost = strcat("$", round(StandardMethodCost, 2)),
    OptimizedMethodCost = strcat("$", round(OptimizedMethodCost, 2)),
    EstimatedMonthlySavings = strcat("$", round(MonthlySavings, 2)),
    SavingsPercentage = strcat(round((MonthlySavings / StandardMethodCost) * 100, 1), "%")
Optional: Advanced filtering with transformKql
The examples (template) above don’t use "transformKql": "source" which routes all data without filtering. You can add KQL transformations to filter data before ingestion, providing even more cost savings.
Filtering at the DCR level provides maximum savings because filtered data never reaches your workspace. However, ensure you’re not filtering out data needed for compliance or future investigations. When in doubt, keep everything and filter during queries instead.
Data analysis and operations
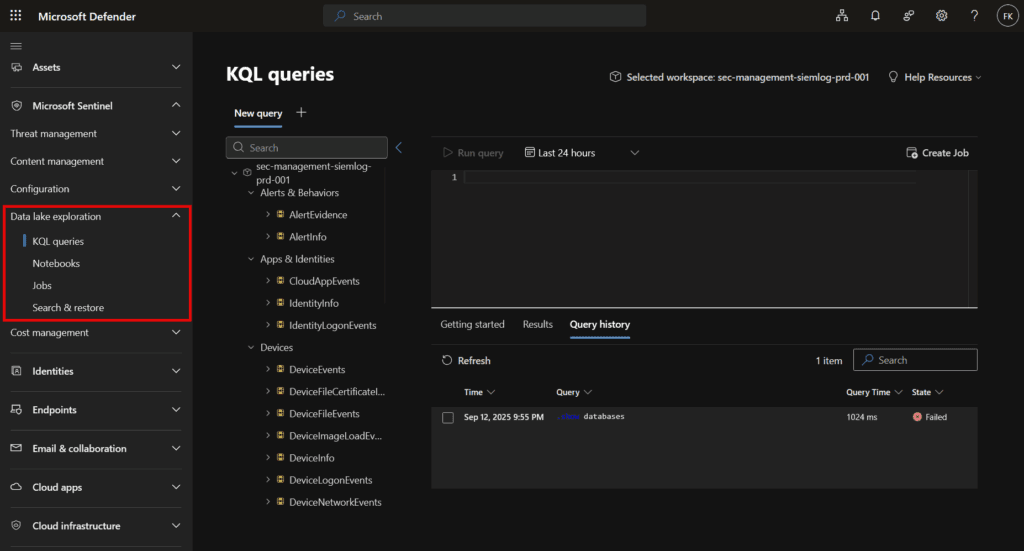
Data lake exploration with KQL
Accessing data lake exploration interface
Navigation steps:
- Navigate to Microsoft Defender Portal → Microsoft Sentinel → Data lake exploration
- Select target workspace from dropdown menu
- Configure appropriate time range for analysis
- Begin KQL query development and execution
Query capabilities and limitations
Supported KQL control commands: Microsoft’s data lake documentation shows the following control commands are currently supported:
.show version
.show databases
.show databases entities
.show database
Performance and functional limitations:
| Limitation category | Specification | Recommended workaround |
|---|---|---|
| Query timeout | 8 minutes maximum | Use time-based filtering and sampling techniques |
| Result size | 500,000 rows or 64MB | Implement summarization and aggregation |
| Concurrent queries | 45 per minute per workspace | Plan and stagger query execution schedules |
| Query scope | Single workspace per query | Design workspace-specific analysis approaches |
Sample queries and optimization
Suspicious travel activity analysis:
SigninLogs
| where TimeGenerated >= ago(180d)
| where ResultType == 0
| summarize CountriesAccessed = make_set(Location) by UserPrincipalName
| where array_length(CountriesAccessed) > 3  // Adjust threshold as needed
Time-first filtering approach:
// Efficient query pattern leveraging time partitioning
SecurityEvent
| where TimeGenerated > ago(7d)     // Partition elimination first
| where Computer startswith "DC"    // Apply specific filters second
| where EventID in (4624, 4625)     // Multiple conditions last
| summarize count() by Computer
Jupyter notebooks for security analytics
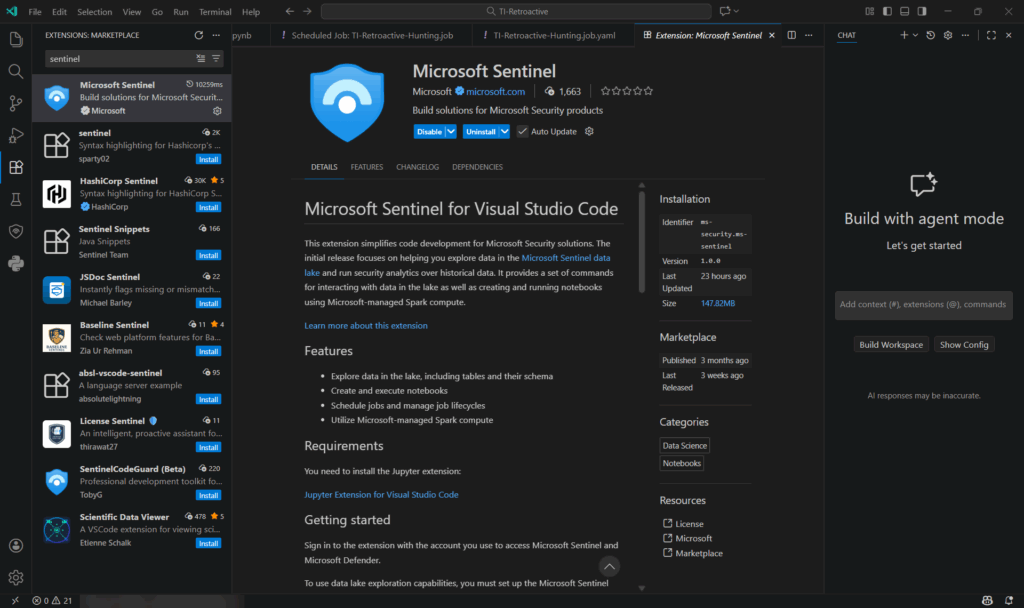
Step 1: Install and configure VS Code extension
Required components:
- Visual Studio Code (latest version)
- Microsoft Sentinel extension for VS Code
- Python environment with appropriate packages
Installation process:
- Open Visual Studio Code
- Navigate to Extensions (Ctrl+Shift+X)
- Search for “Microsoft Sentinel”
- Click Install on the Microsoft Sentinel extension
- Microsoft Sentinel shield icon appears in left toolbar
Step 2: Configure compute resources

Runtime pool options:
| Pool size | Compute resources | Memory | Recommended use cases | Cost considerations |
|---|---|---|---|---|
| Small | 4 cores | 8GB | Basic analytics, data exploration, development | Lower cost, suitable for small datasets |
| Medium | 8 cores | 16GB | Standard security analytics, reporting | Moderate cost, production workloads |
| Large | 16 cores | 32GB | ML models, complex analysis, large datasets | Higher cost, resource-intensive operations |
Microsoft’s billing documentation shows compute hours are calculated by multiplying the number of cores with session time, affecting Advanced Data Insights billing.
Step 3: Develop security analytics workflows
Basic data exploration example:
from sentinel_lake.providers import MicrosoftSentinelProvider
import pandas as pd
import matplotlib.pyplot as plt

# Initialize data provider
data_provider = MicrosoftSentinelProvider(spark)

# Read data from custom data lake table
df = data_provider.read_table("DeviceNetworkEventsLake_CL")
df.select("TimeGenerated", "DeviceName", "ProcessName", "ProcessCommandLine").show(10)
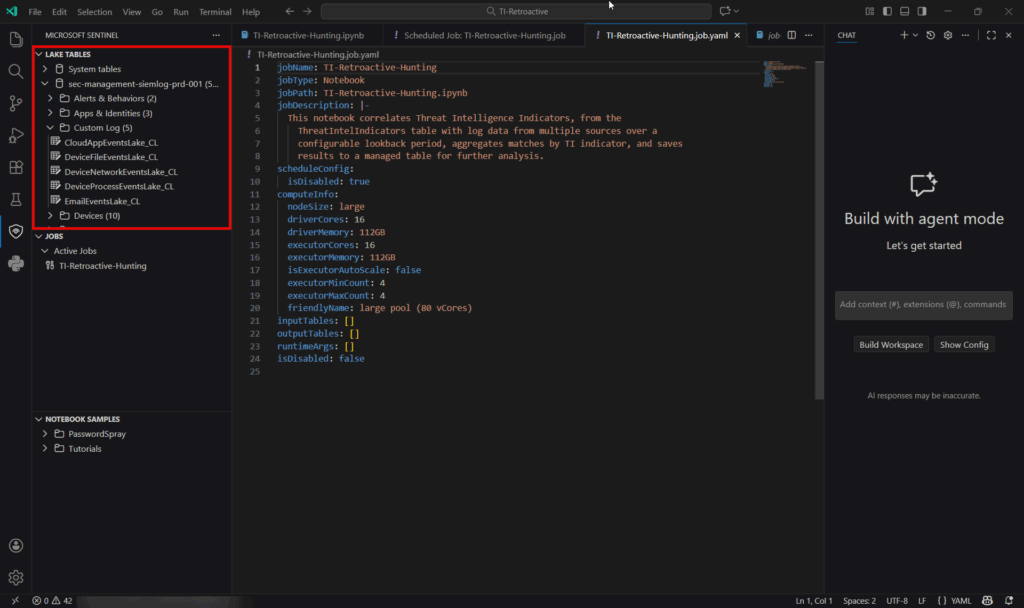
Automated jobs and scheduling
Understanding data lake jobs
Microsoft’s job documentation shows that jobs enable automated analysis and data promotion between tiers. Two primary job types are supported:
- KQL jobs: Query-based analytics using KQL syntax
- Notebook jobs: Python/Spark analytics using Jupyter notebooks
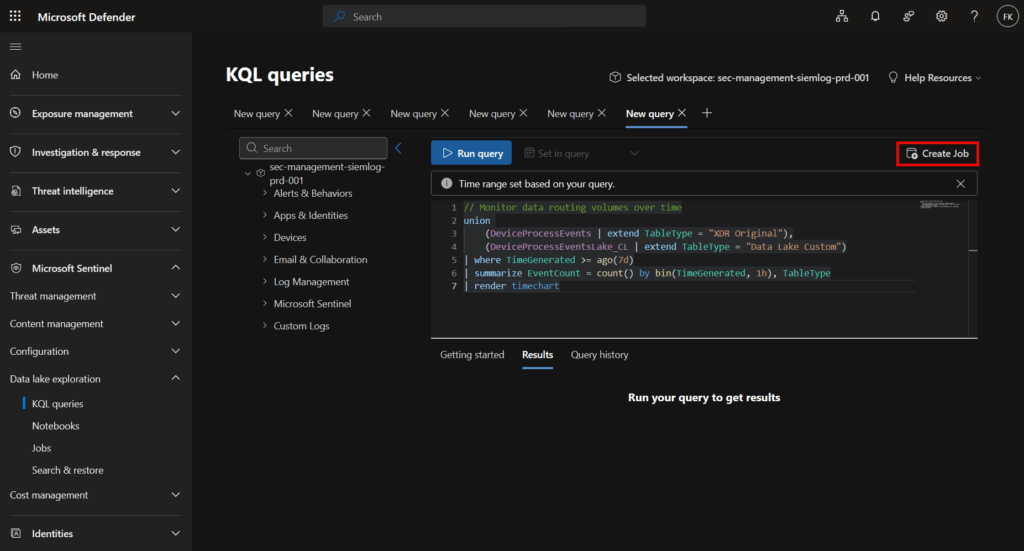
Creating and managing KQL jobs
- Navigate to Microsoft Defender Portal → Microsoft Sentinel → Data lake exploration
- Develop and test your KQL query
- Click Create job button in upper right corner
Job limitations during preview:
| Limitation category | Specification | Impact on implementation |
|---|---|---|
| Concurrent executions | 3 per tenant maximum | Requires queue management and scheduling coordination |
| Job timeout | 1 hour maximum execution time | Necessitates query optimization for complex operations |
| Enabled jobs | 100 per tenant maximum | Requires lifecycle planning and job prioritization |
Performance monitoring and optimization
Microsoft’s data lake exploration documentation shows search functionality within results and comprehensive query management capabilities.
Performance optimization guidelines:
| Performance area | Limitation | Optimization strategy |
|---|---|---|
| Query execution time | 8 minutes maximum | Implement time-based filtering and data sampling |
| Result set size | 500,000 rows or 64MB | Use summarization and aggregation techniques |
| Concurrent operations | 45 queries per minute | Plan and schedule query execution appropriately |
| Data processing | Single workspace scope | Design workspace-specific analysis workflows |
Troubleshooting common issues
Onboarding error codes
Microsoft’s troubleshooting documentation provides specific error codes for common onboarding issues:
DL101: Regional mismatch error
Error: Can't complete setup
Description: Primary workspace region differs from tenant home region
Resolution: Ensure workspace is in same region as tenant home region
DL102: Resource availability error
Error: Lack of Azure resources in region
Description: Insufficient Azure resources available during provisioning
Resolution: Retry setup or attempt during off-peak hours
DL103: Azure policy restrictions
Error: Azure policies prevent resource creation
Description: Organizational policies blocking required resource creation
Resolution: Create policy exemption for Microsoft.SentinelPlatformServices
Data integration troubleshooting
Data not appearing in data lake:
- Wait period: Refer to the sections above for estimated timeline expectations
- Connector verification: Verify data connector configuration and status
- Retention settings: Check tier configuration and retention policies
- Permissions: Validate managed identity permissions and role assignments
Best practices and governance
Security and access management:
- Implement principle of least privilege access
- Conduct regular access reviews and role assignments
- Use Unified RBAC for granular workspace-specific permissions
- Monitor data access through comprehensive audit logs
Cost management best practices:
- Use time-based filtering for optimal partition elimination
- Implement appropriate sampling techniques for large datasets
- Monitor query patterns and associated costs regularly
- Balance operational needs with cost optimization objectives
Additional information
Official Microsoft documentation:
Community resources:
- Microsoft Security Blog – GA announcement
- Microsoft Security Blog – graph launch
- Microsoft Tech Community
Conclusion
When I first started testing with Microsoft Sentinel data lake, I’ll be honest – the pricing models and retention tiers felt overwhelming. But after implementing it across multiple environments and seeing the cost savings firsthand, I’m convinced this is one of the most significant improvements Microsoft has made to Sentinel.
Why this matters to me (and probably to you too):
We’ve all been in those budget meetings where leadership questions why security data retention costs so much. The data lake finally gives us a real answer to that problem. Being able to keep years of security logs without burning through budget means we can actually do our jobs properly – hunt for threats, investigate incidents thoroughly, and meet compliance requirements without constantly worrying about costs.
My honest take on implementation:
The standard retention configuration through the Defender portal is straightforward – you can set it up in minutes. For most Sentinel tables, it just works and the 90 days of free analytics storage is genuinely helpful. Where it gets tricky is with XDR tables. That 30-day limit catches a lot of people off guard, and suddenly you’re looking at massive ingestion bills if you’re not careful.
What I’ve learned along the way:
Start simple. Don’t try to optimize everything at once. Get comfortable with basic retention configuration first, understand your data volumes, and then decide if the advanced DCR approach makes sense for your environment. Monitor your costs closely in the first few months – you’ll quickly see which tables are driving expenses and where optimization efforts will have the biggest impact.
Also, don’t underestimate the value of having historical data readily available. I’ve been in too many investigations where we needed logs from 6+ months ago and they were either gone or stuck in some archived format that took hours to access. The data lake solves that problem elegantly.
Looking ahead:
Microsoft Sentinel data lake is now GA, which means it’s stable and production-ready. The pricing has settled down, the features are solid, and the performance is good. I’m excited to see where Microsoft takes this – the foundation is there for some really powerful capabilities around AI-driven analysis and long-term behavioral detection. I will try to cover MCP and Graph in my next posts, also digging more in Jupyter and Notebooks soon :-).
If you’re still on the fence about enabling data lake, my advice is simple: just do it. The automatic mirroring from analytics to data lake costs nothing, and you’ll immediately have a safety net for your data. You can always optimize later, but at least you won’t lose historical data while you’re figuring out your strategy.
Final thoughts:
Security operations is hard enough without having to choose between doing the right thing and staying within budget. The data lake removes that impossible choice. Yes, there’s complexity to manage. Yes, you need to understand the cost model. But the alternative – deleting security logs because you can’t afford to keep them – is far worse.
Take the time to understand your options, configure things properly, and you’ll have a data retention strategy that actually works for both security and finance. And honestly? That’s a win we don’t get very often in this field.