
Introduction
In the face of increasing cybersecurity threats, early detection and analysis of attack behaviors are essential for proactive defense. Honeypots are invaluable tools that simulate vulnerable systems, attracting malicious actors and enabling security teams to study real attack methods without risking production environments.
T-pot is an advanced honeypot framework that combines multiple honeypots, each simulating specific services like SSH, web servers, and industrial control systems (ICS). By integrating T-pot with Microsoft Sentinel, a cloud-native Security Information and Event Management (SIEM) tool, security teams can centralize honeypot data, enabling real-time analysis, monitoring, and automated alerting.
This guide walks you through each step to configure T-pot, set up data collection rules (DCR) with the Azure Monitor Agent (AMA), and create visualizations and alerts in Sentinel to leverage T-pot data as a valuable source of threat intelligence.
Prerequisites
Ensure you have the following resources and configurations in place to successfully integrate T-pot with Microsoft Sentinel using data collection rules:
| Requirement | Description |
|---|---|
| Azure subscription | Required to access Log Analytics and Microsoft Sentinel |
| Log Analytics workspace | A Log Analytics workspace in Azure to collect and analyze logs from T-pot honeypots |
| Dedicated server for T-pot | Recommended specs: 4 CPU cores, 8 GB RAM (16 GB preferred), and 128 GB SSD |
| Azure Monitor Agent (AMA) | Installed on the T-pot server to securely forward logs using DCR |
| Network configuration | Assign a static IP to the T-pot server, with necessary ports open for Azure connectivity |
T-pot basics
T-Pot is designed as a highly modular and containerized honeypot solution, providing an out-of-the-box experience for capturing and analyzing malicious traffic. It comes preconfigured with several powerful modules that cater to various aspects of threat detection and analysis. Leveraging Docker containers for modularity, T-Pot ensures that each honeypot instance and its supporting services operate independently, making it highly flexible and resilient.
Key Modules and Capabilities
- Honeypots:
- T-Pot integrates a variety of honeypots, including Cowrie (SSH/Telnet), Dionaea (malware collection), Elasticpot (Elasticsearch), and others, to attract and log different types of malicious activities.
- Each honeypot is optimized for capturing specific threat vectors, from brute-force attacks to vulnerability exploits and malware delivery attempts.
- Data Visualization and Management:
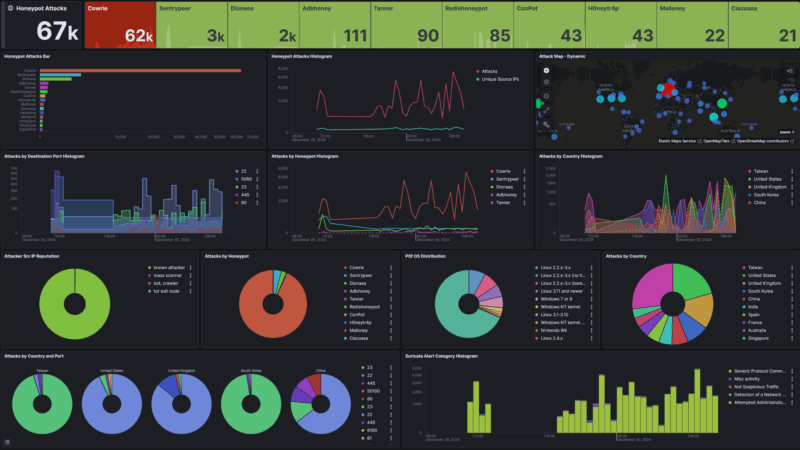
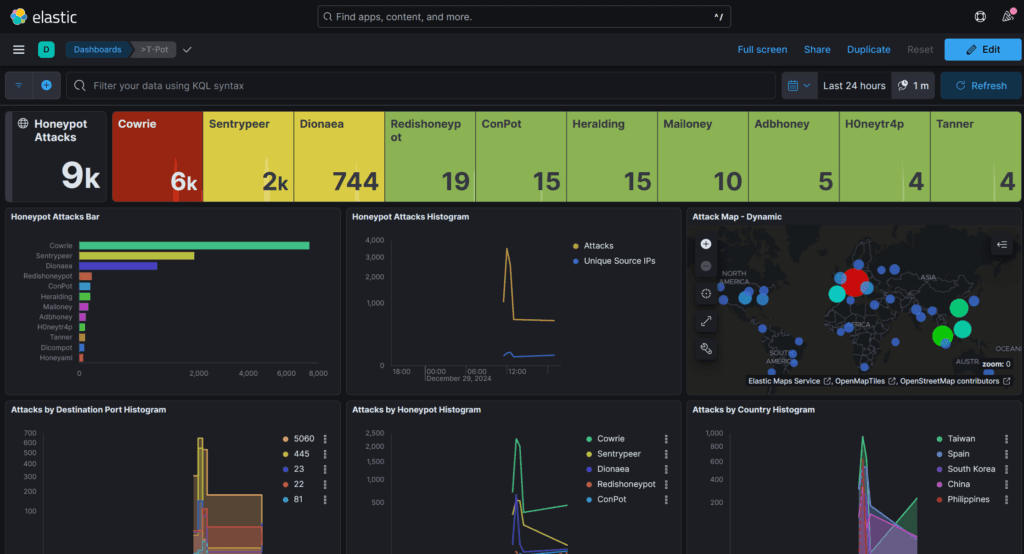
- Kibana: Offers a powerful web-based interface for visualizing logs and attack patterns stored in Elasticsearch. With prebuilt dashboards, you can quickly assess incoming threats and identify attack trends.
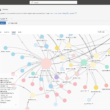
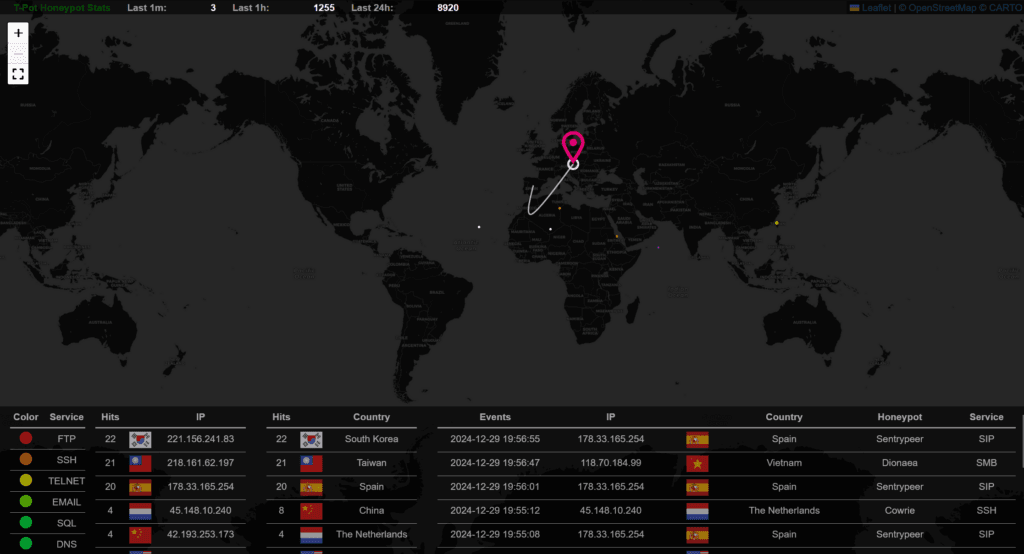
- Attack Map: T-Pot includes a live, real-time global attack map that visualizes connections and attack attempts, providing insights into threat actor origins and targets.
- Cockpit: A server management tool for monitoring system health, performance, and logs via a secure web interface.
- Dockerized Architecture:
- T-Pot uses Docker to isolate each honeypot and supporting service, ensuring operational independence and easier maintenance.
- This architecture makes T-Pot highly scalable, as you can add or remove honeypots without affecting the core platform.
- Integrated Threat Analysis Tools:
- The stack also includes Heralding for monitoring authentication attempts and Tarpit to capture and delay malicious connections.
These components work together to provide a seamless and integrated view of your honeypot environment, empowering you to detect, analyze, and respond to threats with minimal configuration effort.
Setting up the T-pot honeypot environment
Installing T-pot from the repository
Prepare your server with a fresh installation of Ubuntu Server 22.04 or newer and ensure all packages are updated:
sudo apt update && sudo apt upgrade -y
Install essential tools like Git, Curl, and Wget:
sudo apt install git curl wget -y
Create a new user (in my example I name it tpotuser):
adduser tpotuser
usermod -aG sudo tpotuser
su - tpotuser
Clone the T-pot repository from GitHub:
git clone https://github.com/telekom-security/tpotce.git
Navigate to the installer directory:
cd tpotce
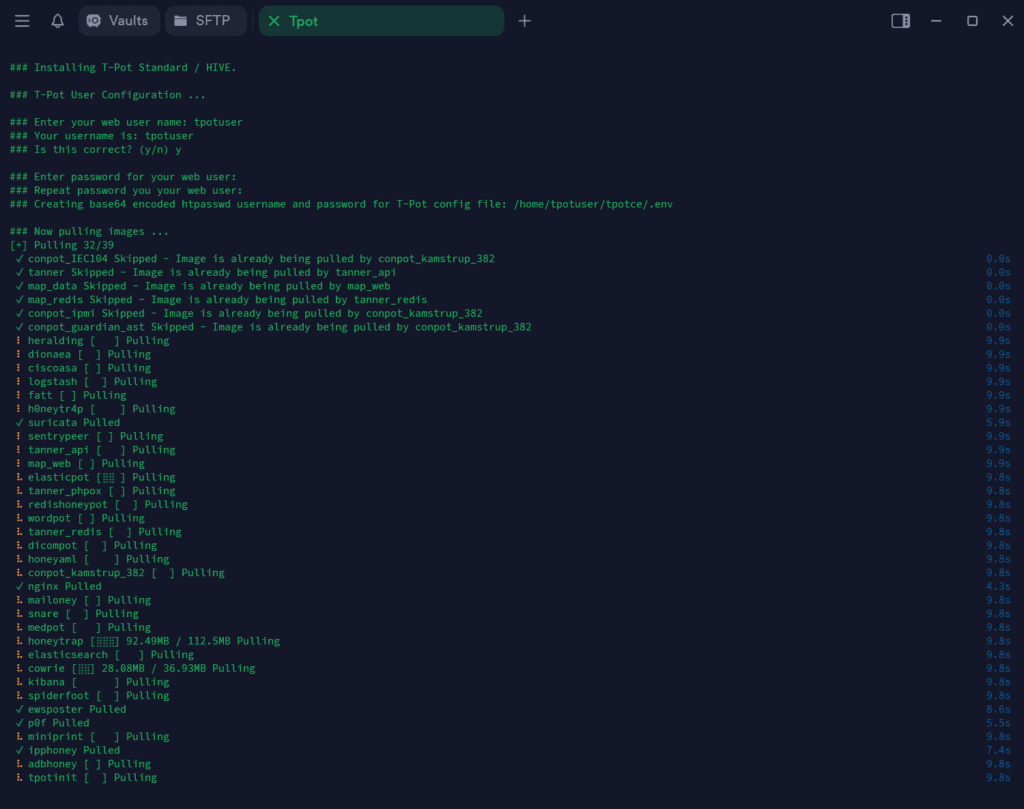
Run the installation script to begin setup
./install.sh
Follow the prompts, this will:
- Change the SSH port to
tcp/64295 - Disable the DNS Stub Listener to avoid port conflicts with honeypots
- Set SELinux to Monitor Mode
- Set the firewall target for the public zone to ACCEPT
- Add Docker’s repository and install Docker
- Install recommended packages
- Remove packages known to cause issues
- Add the current user to the docker group (allow docker interaction without
sudo) - Add
dpsanddpswaliases (grc docker ps -a,watch -c "grc --colour=on docker ps -a) - Add
la,llandlsaliases (forexa, a improvedlscommand) - Add
mi(formicro, a great alternative toviand / ornano) - Display open ports on the host (compare with T-Pot required ports)
- Add and enable
tpot.serviceto/etc/systemd/systemso T-Pot can automatically start and stop
Reboot the system after installation completes:
sudo rebootMake sure to SSH into the new port (64295), otherwise you won’t be able to get back into the server.
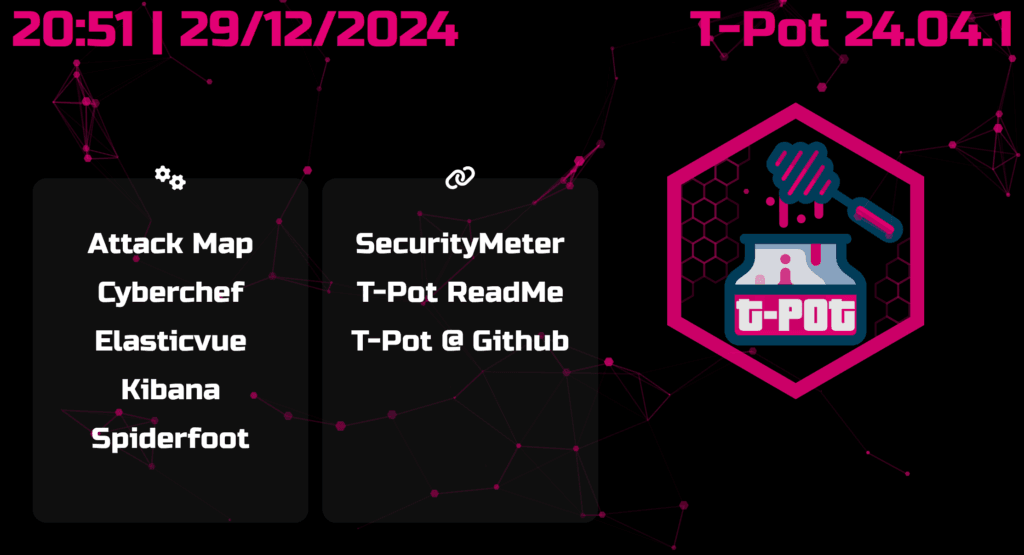
Exploring T-Pot’s unified web interfaces
T-Pot provides centralized access to its monitoring, management, and analysis tools through a single port and web-based structure. All interfaces are accessible under the https:// base URL, simplifying navigation while maintaining a clean and unified setup. While my setup has everything based on my default IP, you can change them to your own configuration if needed ;).
Default URLs for T-Pot web interfaces
| Portal name | Purpose | Default URL |
|---|---|---|
| T-Pot Dashboard | Central access point for T-Pot services | https:// |
| Attack Map | Real-time global attack visualization | https:// |
| CyberChef | A tool for decoding, encoding, and analyzing data | https:// |
| Elasticvue | Visualization and management for Elasticsearch | https:// |
| Kibana | Log visualization and analysis tool | https:// |
| Spiderfoot | Open-source reconnaissance tool | https:// |
| Portainer (if enabled) | Docker container management interface. | Not explicitly mapped in T-Pot (but if enabled :9443) |
Details of web interfaces you will probably use the most
T-Pot Dashboard
- URL:
https://:64297/
Attack Map
- URL:
https://:64297/map/
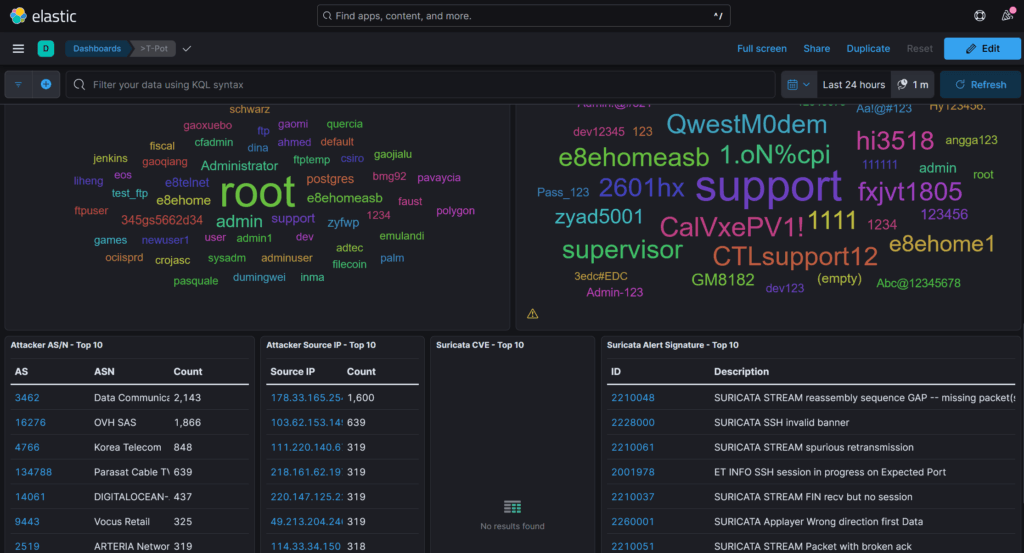
Kibana
- URL:
https://:64297/kibana/
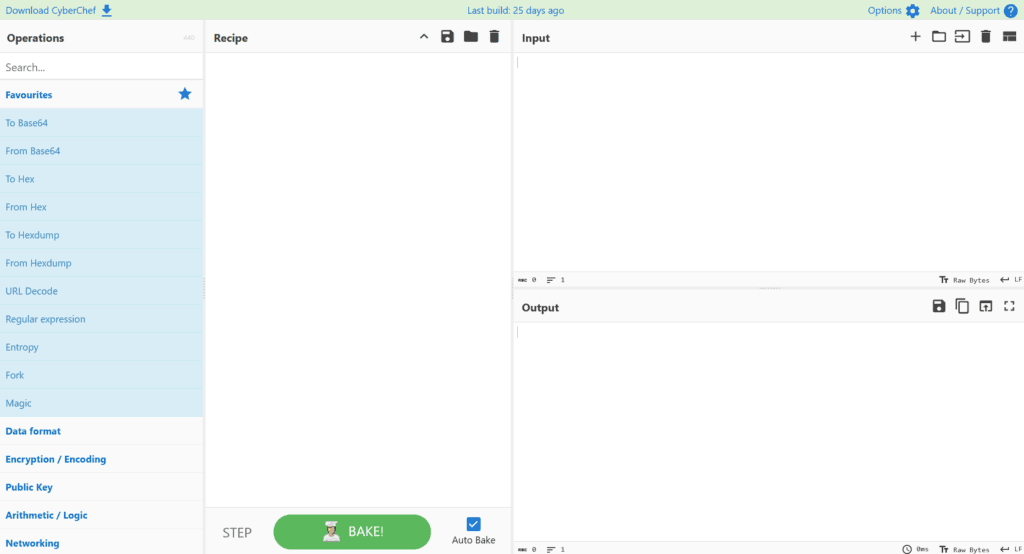
CyberChef
- URL:
https://:64297/cyberchef/
Installing Azure Monitor Agent (AMA) and configuring DCR
When integrating T-Pot with Microsoft Sentinel, a critical step is configuring data ingestion. Azure offers several options for collecting and forwarding logs, but the process can vary depending on your setup and the tools you use. Here, we’ll discuss the onboarding requirements for Data Collection Rules (DCR), the benefits of Azure Arc, and alternative log-forwarding methods.
Onboarding to Azure Arc for DCR
To use Data Collection Rules (DCR) effectively, your server must be onboarded to the Azure Monitor Agent (AMA). AMA requires Azure Arc onboarding for non-Azure servers, such as those running on on-premises or third-party cloud providers.
Why onboard to Azure Arc?
Azure Arc extends Azure management and monitoring capabilities to non-Azure resources, including:
- DCR Functionality: Arc-enabled servers can leverage the full benefits of DCR, including granular log filtering and routing to multiple destinations
- Centralized Management: Manage all your servers (Azure and non-Azure) in a single pane of glass using Azure
- Advanced Monitoring: Use tools like Log Analytics and Sentinel seamlessly for hybrid environments
Benefits of Azure Arc with AMA
- Simplifies management for hybrid and multi-cloud environments
- Enables DCR for precise log filtering and forwarding
- Provides seamless integration with Microsoft Sentinel for advanced threat detection
Alternative Log Collection and Forwarding Scenarios
If onboarding to Azure Arc is not an option or if you’re exploring other setups, there are several alternative methods for forwarding logs to Microsoft Sentinel:
Logstash
- Scenario: Useful if you’re already using the Elastic Stack to manage logs
- Benefits:
- Allows advanced log transformation and enrichment
- Easily integrates with Elasticsearch setups
Log Analytics HTTP Data Collector API
- Scenario: Ideal for custom or lightweight setups where you want to send logs directly without relying on AMA or Logstash.
- Benefits:
- Provides a lightweight, flexible solution for direct log ingestion
- Can be used for specific log types or custom workflows
Syslog forwarding
- Scenario: Leverages native Syslog for environments already configured with centralized Syslog servers.
- Benefits:
- Integrates easily with existing Syslog infrastructure
- Simplifies log forwarding to AMA through facilities and severities
Choosing the best approach
| Scenario | Best Method |
|---|---|
| On-premises or non-Azure cloud server | Onboard to Azure Arc and AMA |
| Existing Elastic Stack environment | Use Logstash |
| Lightweight custom integration | Use the Log Analytics HTTP API |
| Existing Syslog setup | Configure AMA for Syslog forwarding |
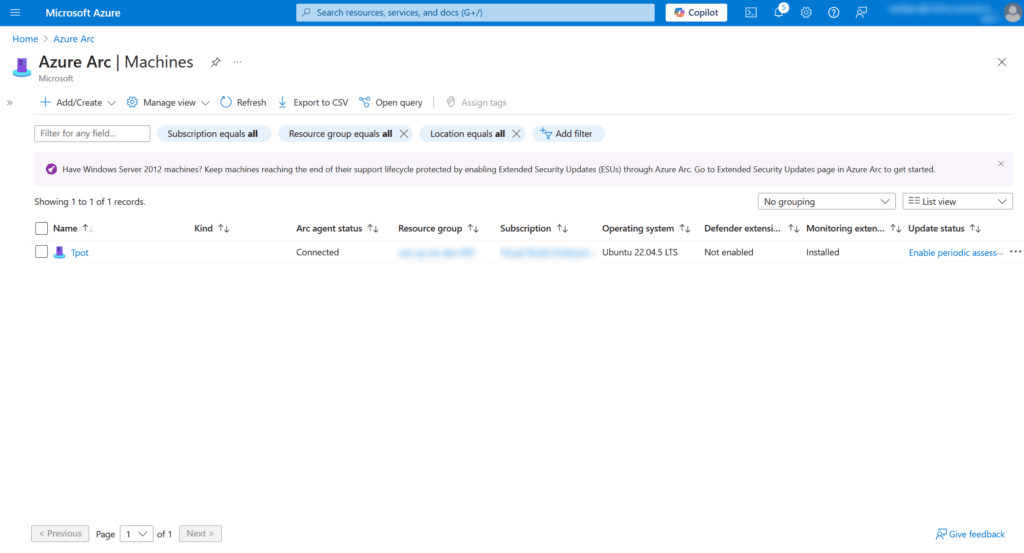
By onboarding your server to Azure Arc and AMA, you gain the most seamless experience with Microsoft Sentinel, including full support for DCR. In my example I onboarded my T-Pot server to ARC and enabled the monitoring extension:
However, alternative methods like Logstash and APIs offer flexibility for more customized setups, enterprise etc. Each method comes with its own benefits, and the choice depends on your specific infrastructure and operational needs.
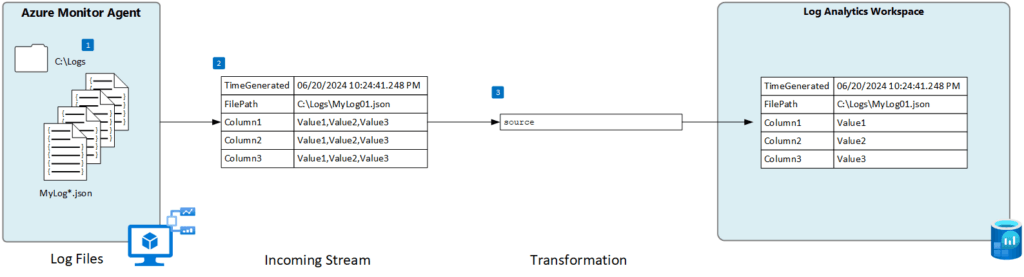
Creating data collection rules (DCR)
When integrating T-Pot with Microsoft Sentinel, creating a Data Collection Rule (DCR) is a critical step to ingest logs from T-Pot honeypots. This process requires precise configuration to ensure only relevant data is collected, saving costs while maintaining functionality.
This section will guide you through configuring DCR based on the working T-Pot setup. We’ll use the correct file paths for T-Pot logs, enable only the necessary JSON files to be ingested, as you can read on the KB from Microsoft:
https://learn.microsoft.com/en-us/azure/azure-monitor/agents/data-collection-log-json
Correct File Paths for T-Pot Logs
Each honeypot in T-Pot generates logs in specific JSON files, typically stored under the /home/tpotuser/tpotce/data/
- Cowrie:
/home/tpotuser/tpotce/data/cowrie/log/cowrie.json - Dionaea:
/home/tpotuser/tpotce/data/dionaea/log/dionaea.json - Elasticpot:
/home/tpotuser/tpotce/data/elasticpot/log/elasticpot.json
Creating the Data Collection Endpoint (DCE)
The DCE serves as the gateway for Azure Monitor to ingest logs from T-Pot honeypots (add it via Azure Cloud Shell – as MS doesnt allow to do this via the portal at this moment) :
# Parameters
$SubscriptionId = "xxxxxxxxxxxxxxxxxxxxxxxxxxxxxxxxxxxxxxxxxxx"
$ResourceGroupName = "xxxxxxxxxxxxxxxxxxxxxxxxxxxxxxxxxxxxxxxxxxx"
$DCEName = "Tpot-DCE"
$Location = "xxxxxxxxxxxxxxxxxxxxxxxxxxxxxxxxxxxxxxxxxxx"
$ApiVersion = "2023-03-11"

# Construct the API URL using UriBuilder
$UriBuilder = New-Object System.UriBuilder("https://management.azure.com")
$UriBuilder.Path = "/subscriptions/$SubscriptionId/resourceGroups/$ResourceGroupName/providers/Microsoft.Insights/dataCollectionEndpoints/$DCEName"
$UriBuilder.Query = "api-version=$ApiVersion"
$Uri = $UriBuilder.Uri.AbsoluteUri

# DCE Body
$DCEBody = @{
    location = $Location
    properties = @{
        publicNetworkAccess = "Enabled"
    }
}

# Convert to JSON
$DCEBodyJson = $DCEBody | ConvertTo-Json -Depth 10 -Compress

# Execute REST API Request
Invoke-RestMethod -Uri $Uri -Method Put -Body $DCEBodyJson -ContentType "application/json" -Headers @{
    Authorization = "Bearer $(az account get-access-token --query accessToken -o tsv)"
}
Creating Custom Tables
Cowrie Custom Table
This will create a custom table, for in my case Cowrie, based on the schema of the Cowrie JSON columns/output and information needed. My attempt to create a table is based on the analytics tier (because I can only choose basic or analytic tiers in my region), but I suggest to choose the new Auxiliary logs for reducing costs.
# Parameters
$WorkspaceName = "xxxxxxxxxxxxxxxxxxxxxxxxxxxxxxxxxxxxxxxxxxx"
$TableName = "cowrie_tpot_CL"
$ApiVersion = "2021-12-01-preview"

# Table Schema
$TableSchema = @"
{
  "properties": {
    "schema": {
      "name": "$TableName",
      "columns": [
        { "name": "TimeGenerated", "type": "datetime" },
        { "name": "FilePath", "type": "string" },
        { "name": "eventid", "type": "string" },
        { "name": "src_ip", "type": "string" },
        { "name": "username", "type": "string" },
        { "name": "password", "type": "string" },
        { "name": "message", "type": "string" },
        { "name": "sensor", "type": "string" },
        { "name": "session", "type": "string" }
      ]
    }
  }
}
"@

# API URL
$UriBuilder = New-Object System.UriBuilder("https://management.azure.com")
$UriBuilder.Path = "/subscriptions/$SubscriptionId/resourceGroups/$ResourceGroupName/providers/Microsoft.OperationalInsights/workspaces/$WorkspaceName/tables/$TableName"
$UriBuilder.Query = "api-version=$ApiVersion"
$TableUri = $UriBuilder.Uri.AbsoluteUri

# Execute REST API Request
Invoke-RestMethod -Uri $TableUri -Method Put -Body $TableSchema -ContentType "application/json" -Headers @{
    Authorization = "Bearer $(az account get-access-token --query accessToken -o tsv)"
}
Repeat this process for Dionaea and Elasticpot, replacing $TableName and updating columns to match their respective log structures. The best thing to match the columns is to take snippets/examples of the current logfiles you have.
Creating the Data Collection Rule (DCR)
Cowrie DCR
# Parameters
$DCRName = "cowrie_tpot_dcr"
$DCEId = "/subscriptions/$SubscriptionId/resourceGroups/$ResourceGroupName/providers/Microsoft.Insights/dataCollectionEndpoints/Tpot-DCE"
$WorkspaceId = "/subscriptions/$SubscriptionId/resourceGroups/$ResourceGroupName/providers/Microsoft.OperationalInsights/workspaces/$WorkspaceName"
$FilePath = "/home/tpotuser/tpotce/data/cowrie/log/cowrie.json"
$ApiVersion = "2023-03-11"

# DCR Body
$DCRBody = @{
    location = $Location
    properties = @{
        dataCollectionEndpointId = $DCEId
        streamDeclarations = @{
            "Custom-cowrie_tpot_CL" = @{
                columns = @(
                    @{ name = "TimeGenerated"; type = "datetime" },
                    @{ name = "FilePath"; type = "string" },
                    @{ name = "eventid"; type = "string" },
                    @{ name = "src_ip"; type = "string" },
                    @{ name = "username"; type = "string" },
                    @{ name = "password"; type = "string" },
                    @{ name = "message"; type = "string" },
                    @{ name = "sensor"; type = "string" },
                    @{ name = "session"; type = "string" }
                )
            }
        }
        dataSources = @{
            logFiles = @(
                @{
                    name = "CowrieLog"
                    streams = @("Custom-cowrie_tpot_CL")
                    filePatterns = @($FilePath)
                    format = "json"
                }
            )
        }
        destinations = @{
            logAnalytics = @(
                @{
                    name = "workspace"
                    workspaceResourceId = $WorkspaceId
                }
            )
        }
        dataFlows = @(
            @{
                streams = @("Custom-cowrie_tpot_CL")
                destinations = @("workspace")
            }
        )
    }
}

# Convert to JSON and Execute REST API Request
$DCRBodyJson = $DCRBody | ConvertTo-Json -Depth 10 -Compress
$UriBuilder.Path = "/subscriptions/$SubscriptionId/resourceGroups/$ResourceGroupName/providers/Microsoft.Insights/dataCollectionRules/$DCRName"
$UriBuilder.Query = "api-version=$ApiVersion"
$DCRUri = $UriBuilder.Uri.AbsoluteUri

Invoke-RestMethod -Uri $DCRUri -Method Put -Body $DCRBodyJson -ContentType "application/json" -Headers @{
    Authorization = "Bearer $(az account get-access-token --query accessToken -o tsv)"
}
Repeat for Dionaea and Elasticpot, adjusting $FilePath and $DCRName.
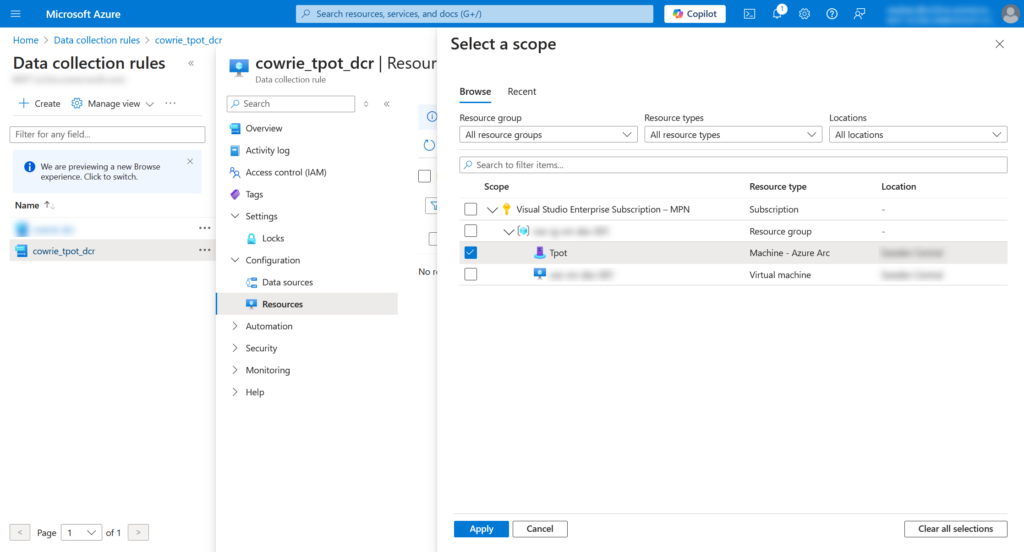
Also make sure to check whether the DCE is correctly added to the DCR (as resource):
Validating Data
If needed you can also create test alerts directly in T-pot, for example into the Cowrie JSON, from a shell:
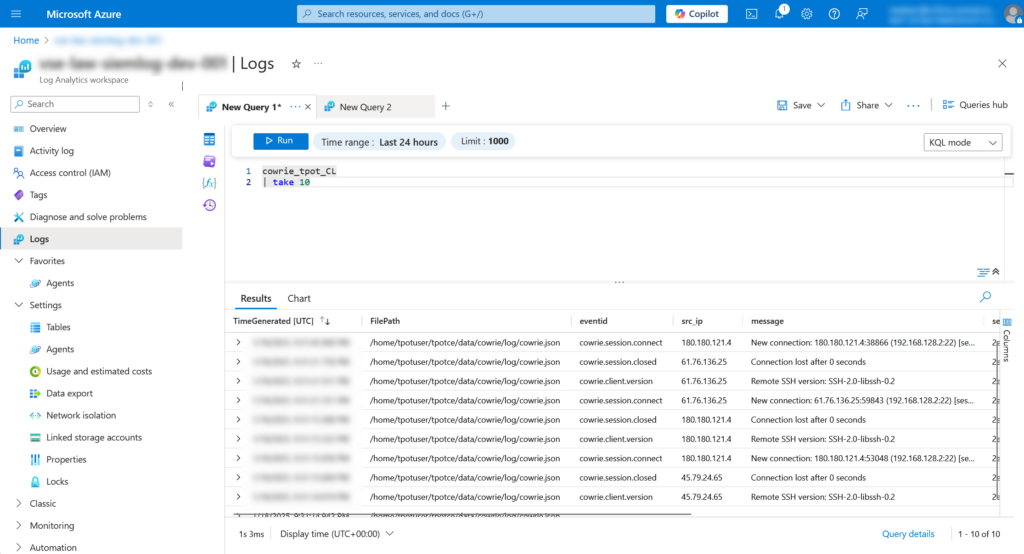
echo '{"eventid": "cowrie.test.log", "message": "Test message for Cowrie", "timestamp": "2024-12-30T17:00:00Z"}' >> /home/tpotuser/tpotce/data/cowrie/log/cowrie.jsonRun the following KQL queries in Log Analytics to see if the data is ingested into the custom table you’ve created:
Cowrie Data
cowrie_tpot_CL
| take 10
Visualizing Data
Workbook Queries
Top Attackers IP:
cowrie_tpot_CL
| where eventid == "cowrie.login.failed"
| summarize AttemptCount = count() by src_ip
| sort by AttemptCount desc
Failed Logins by username:
cowrie_tpot_CL
| where eventid == "cowrie.login.failed"
| summarize AttemptCount = count() by username
| sort by AttemptCount desc
Failed Logins over time:
cowrie_tpot_CL
| where eventid == "cowrie.login.failed"
| summarize Count = count() by username, password, src_ip, bin(TimeGenerated, 1h)
Adding a Workbook
- Go to Workbooks in Azure Monitor
- Create a new workbook, add the queries, visualize with a map for example (needs geolocation API)
- Save and pin the workbook to the dashboard
Optimizing DCR and Sentinel setup
- Filter out unnecessary logs in DCR to reduce ingestion costs
- Set data retention policies in Log Analytics > Usage and estimated costs to manage storage requirements
- Use Auxiliary logs if possible
- Optimize queries and dashboards by using summary operations to improve performance
Troubleshooting common issues
For connectivity issues with the Azure Monitor Agent, check logs:
tail -f /var/opt/microsoft/azuremonitoragent/log/azuremonitoragent.log
Restart the agent if necessary:
sudo systemctl restart azuremonitoragent
Conclusion
Integrating T-pot with Microsoft Sentinel using data collection rules provides a highly effective setup for proactive threat intelligence. This guide equips you to deploy T-pot, configure DCR, and create actionable insights within Sentinel, strengthening your organization’s cybersecurity posture.